Euro / US dollar · 15-minute chart
EURUSD signals
Signals on the euro against the dollar, posted to Telegram as a chart with the entry, stop and four targets drawn, and redrawn at each one. Below: every EURUSD signal in the free channel, and how EURUSD's stop hunts behave.
- Average daily range
- 75 pipsmedian day 67
- Asian range
- 28 pips38% of the day's range
- Stop hunts a week
- 3.2London or New York
- Hunt depth
- 16 pipsmedian, past the Asian range
- Reversal after a hunt
- 54 pipsmedian, from the extreme
- Busiest hour
- 08:00New York, 18% of hunts
Measured on 1,488 trading days of Dukascopy prices, 4 January 2021 to 1 October 2026. Averages over the whole period; recent weeks can run larger or smaller.
EURUSD signals in the free channel
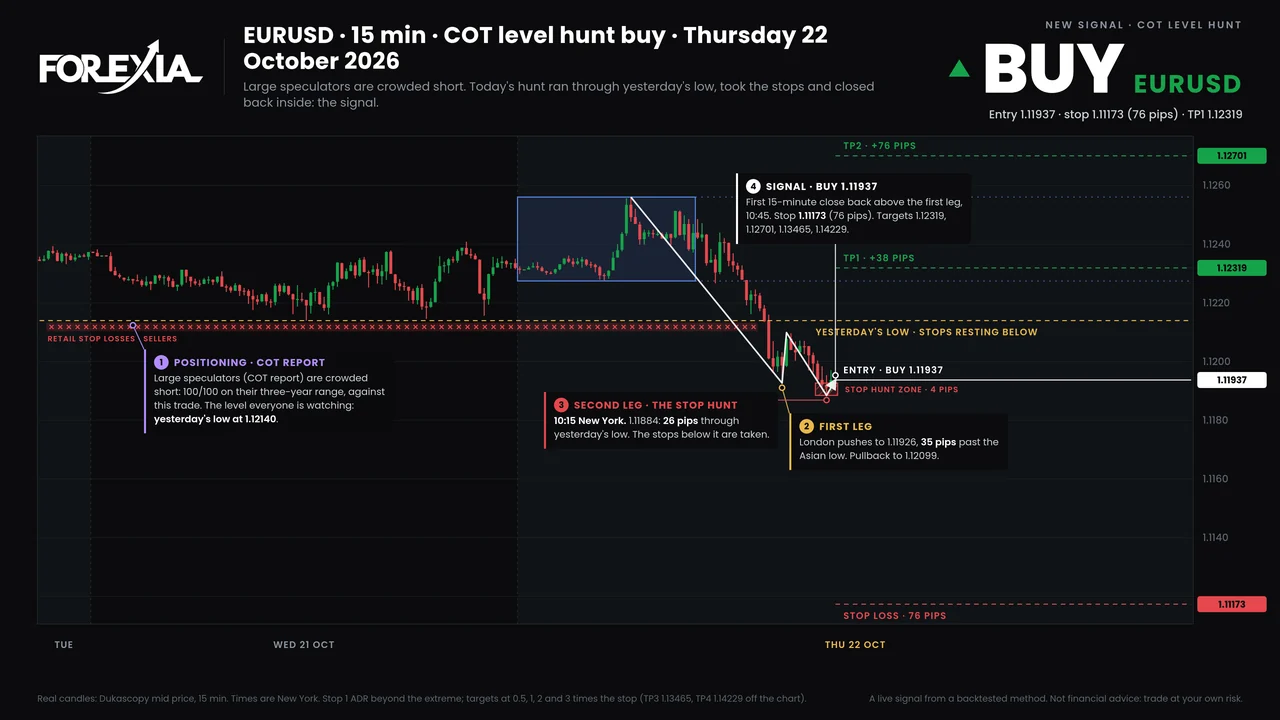
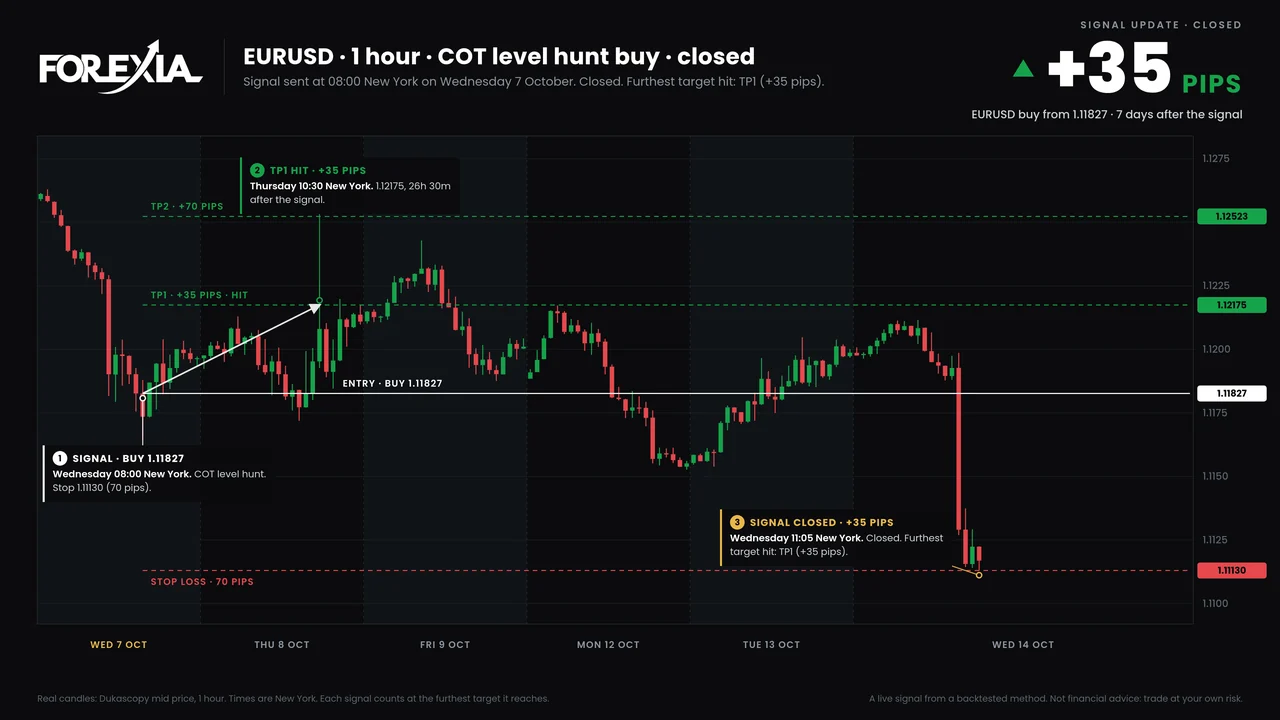
Every EURUSD signal the bot has posted to the free channel since it went live on 4 October 2026, newest first, losses and open ones included.
How EURUSD hunts stops
London or New York breaks 65% of the sides of EURUSD's Asian range, and 49% of those breaks turn out to be stop hunts: about 3.2 a week. Both sides are hunted on 10% of days.
A stop hunt runs a median 16 pips past the Asian range (half of them between 9 and 28; one in ten beyond 43). A break that keeps going, a breakout, runs a median 39 pips.
When an M or W forms, the second leg runs a median 8.3 pips past the first. After a hunt, price reverses a median 54 pips from the extreme (one in ten reverse 99 pips or more).
| Reached | Days | Ended as a stop hunt | Turned within another 5% of ADR | Went on to double it |
|---|---|---|---|---|
| 5% of ADR (4 pips) | 1,878 | 48% | 8% | 92% |
| 10% of ADR (8 pips) | 1,720 | 45% | 10% | 79% |
| 20% of ADR (15 pips) | 1,366 | 39% | 11% | 63% |
| 30% of ADR (23 pips) | 1,085 | 33% | 11% | 46% |
| 50% of ADR (38 pips) | 666 | 19% | 13% | 26% |
| 75% of ADR (56 pips) | 317 | 7% | 12% | 13% |
The further past the range price has gone, the less often the day ends as a stop hunt. This is why the bot waits for the close back instead of selling the first spike: most breaks do not reverse.
When EURUSD stop hunts happen
44% of EURUSD's stop hunts print in London and 56% in New York. 20% print within 15 minutes of a high-impact release for one of its currencies. The busiest hours, New York time:
| Hour (New York) | Share of hunts |
|---|---|
| 08:00 | 18% |
| 09:00 | 17% |
| 03:00 | 12% |
| 10:00 | 12% |
28% of hunts take the previous day's high or low, 8% the previous week's and 3% the previous month's. Those are the levels where the crowd's stops sit, and the levels the bot's COT level hunt needs.
| Mon | Tue | Wed | Thu | Fri | |
|---|---|---|---|---|---|
| High of the week | 29% | 16% | 13% | 19% | 23% |
| Low of the week | 27% | 12% | 16% | 16% | 30% |
A midweek reversal (the week's high or low on Tuesday to Thursday, then 1.25 average daily ranges the other way) came in 55% of weeks.
What the bot does on EURUSD
It reads EURUSD's 15-minute candles every five minutes, around the clock from Sunday evening to Friday evening, and looks for two setups written down as rules: the Signature Trade, a stop hunt that forms an M or a W, and the COT level hunt, a hunt of a prior high or low against a crowded position in the COT report.
When one fires, it posts the chart with the entry at the close back, a stop one average daily range beyond the extreme (it uses the live figure, not the average above), and four targets at half, one, two and three times the stop. Then it follows the trade and replies at every target and at the stop, with the chart redrawn. Nothing is managed: the stop never moves, and a signal still open after ten trading days closes at the market.
Automate a strategy on EURUSD
For channel owners: well-known strategies written as code for the bot, each shown on a real signal its code found. Early access; no results are published for them.
Opening range breakout
The first 15 minutes after the New York open set a range; the first 5-minute close outside it is the signal.
EMA crossover
The 9 EMA closes across the 21 EMA in the direction of the 200 EMA: a buy above it, a sell below it.
Break and retest
Price closes beyond a swing high or low, comes back to the level within twelve candles and closes on the broken side: that close is the signal.
MACD crossover
The MACD line crosses its signal line below zero in an uptrend, or above zero in a downtrend, with price on the 200 EMA's side.
Questions
Are there free EURUSD signals?
Yes. The free Telegram channel gets up to six signals a month across the eight markets the bot covers, EURUSD among them. It has posted 2 EURUSD signals there since 4 October 2026, listed above. ForexiaPRO members get every signal.
When do EURUSD signals usually come?
A signal follows a stop hunt, and EURUSD's hunts cluster at 08:00 New York (18% of them) and 09:00 (17%). The signal itself comes at the first 15-minute close back inside, so usually later than the spike.
How big is the stop on a EURUSD signal?
One average daily range beyond the extreme of the hunt, using the range as it stands that day. Over the period measured, EURUSD's average daily range was 75 pips. The four targets are half, one, two and three times the stop.
Does the bot trade EURUSD for me?
No. It posts signals and follows them. What you trade, and how much, is your decision. Trading on margin carries a high risk of losing money.