Strategy template · early access
Order block strategy, automated
A strong candle breaks the last swing high; the last down candle before it is the block, and the first return into it is the signal. The bot runs it on real candles, draws each signal and posts it to your Telegram channel, built with you in early access.
What the order block is
An order block is the last candle against a strong move, taken as the place where that move began. When price runs up hard and breaks the last swing high, the last down candle before the run is marked, on the idea that the orders that drove the move were placed there and price may return to them before it goes on.
It is a trader's name for an old pattern, the last base before a strong move. The rules are mechanical here: a candle of a set size, a close beyond a swing, the last opposite candle before it, and the first return into its range.
The bot's rules
- A bullish displacement is a 15-minute candle that closes up, with a body of at least 1.2 times the ATR(14), and closes above the last swing high (a swing needs 3 lower candles on each side, and is used only once they have closed). A bearish one mirrors it.
- The order block is the last bearish candle in the 5 candles before the displacement (the last bullish one for a sell); its zone runs from its high to its low.
- Buy at the close of the first later candle, within 30 candles, whose low reaches the zone's high and which closes above its low. If a candle closes through the zone first, it is void.
- Stop beyond the zone, plus 0.1 times the ATR(14). Targets at 1, 2, 3 times the stop distance. Each block is traded once.
Which version. The break-of-structure version, as it is usually taught: the last opposite candle before a displacement candle that closes beyond the last swing, entry on the first return into that candle's range.
The settings
The defaults the example was found with. Each one is a setting, not a rewrite.
| Setting | Default | What you can change |
|---|---|---|
| Market | XAUUSD | Gold or any of the seven US-dollar majors; other markets need a price feed first. |
| Candles | 15 minutes | The block and the return are found on these. |
| Displacement body | 1.2 × ATR(14) | The break must be a candle at least this big. Raise it for fewer, stronger breaks. |
| Block looked for in | the 5 candles before | The last opposite candle in this many. |
| Return within | 30 candles | A block not revisited by then is dropped. |
| Stop buffer | 0.1 × ATR(14) | Added beyond the block. |
| Swing | 3 candles each side | How a swing high or low is found. |
| Targets | 1, 2, 3 × the stop | Or the last swing, or the displacement's extreme. |
The example, as the bot would post it
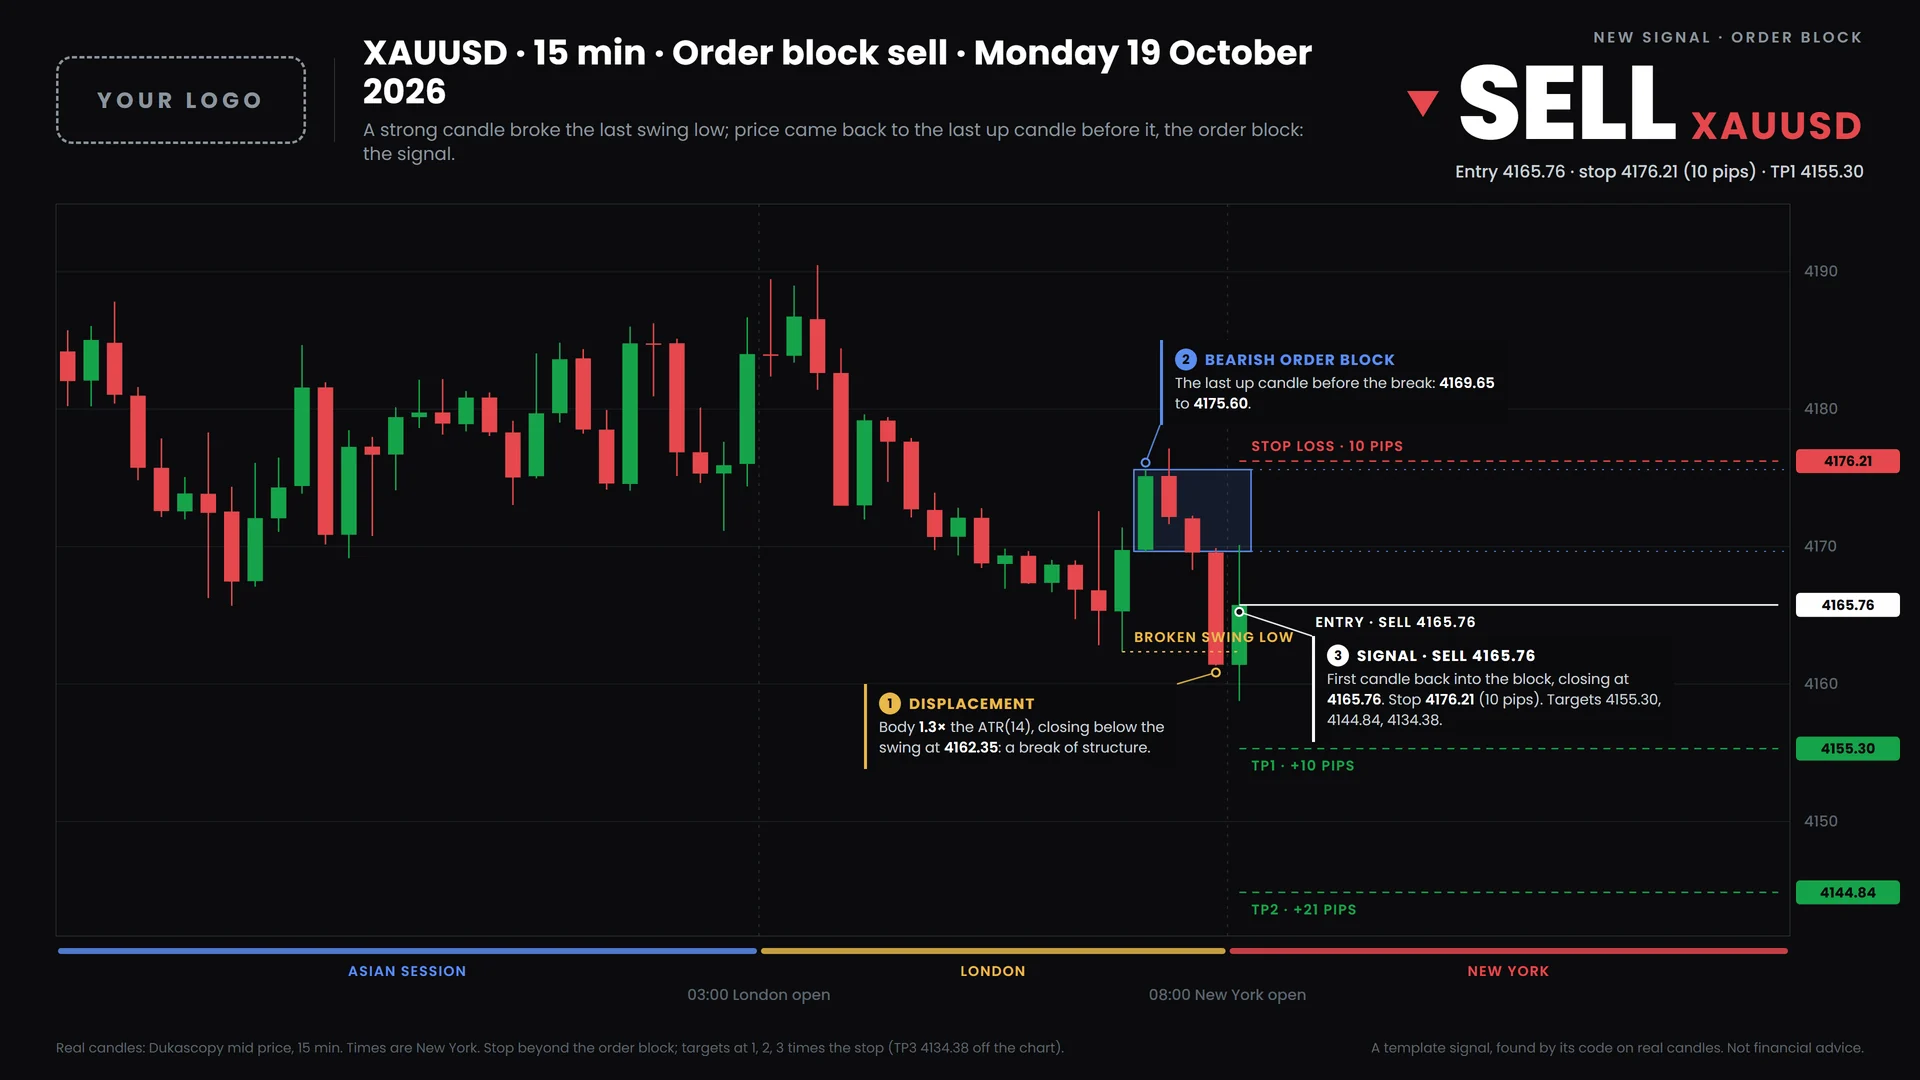
The signal in the chart above: found by the template's code on XAUUSD 15 min candles at . Its levels, and the message the bot would send with the chart:
- Entry4165.76
- Stop4176.21 · 10 pips
- TP14155.30 · +10 pips
- TP24144.84 · +21 pips
- TP34134.38 · +31 pips
🔴 SELL XAUUSD · Order block

Entry: 4165.76 (market)
Stop: 4176.21 (10 pips)
TP1: 4155.30 (+10 pips)
TP2: 4144.84 (+21 pips)
TP3: 4134.38 (+31 pips)

Price returned to an order block after a break of structure. Stop beyond the block; targets at 1, 2, 3 times the stop.

Not financial advice. Trade at your own risk.
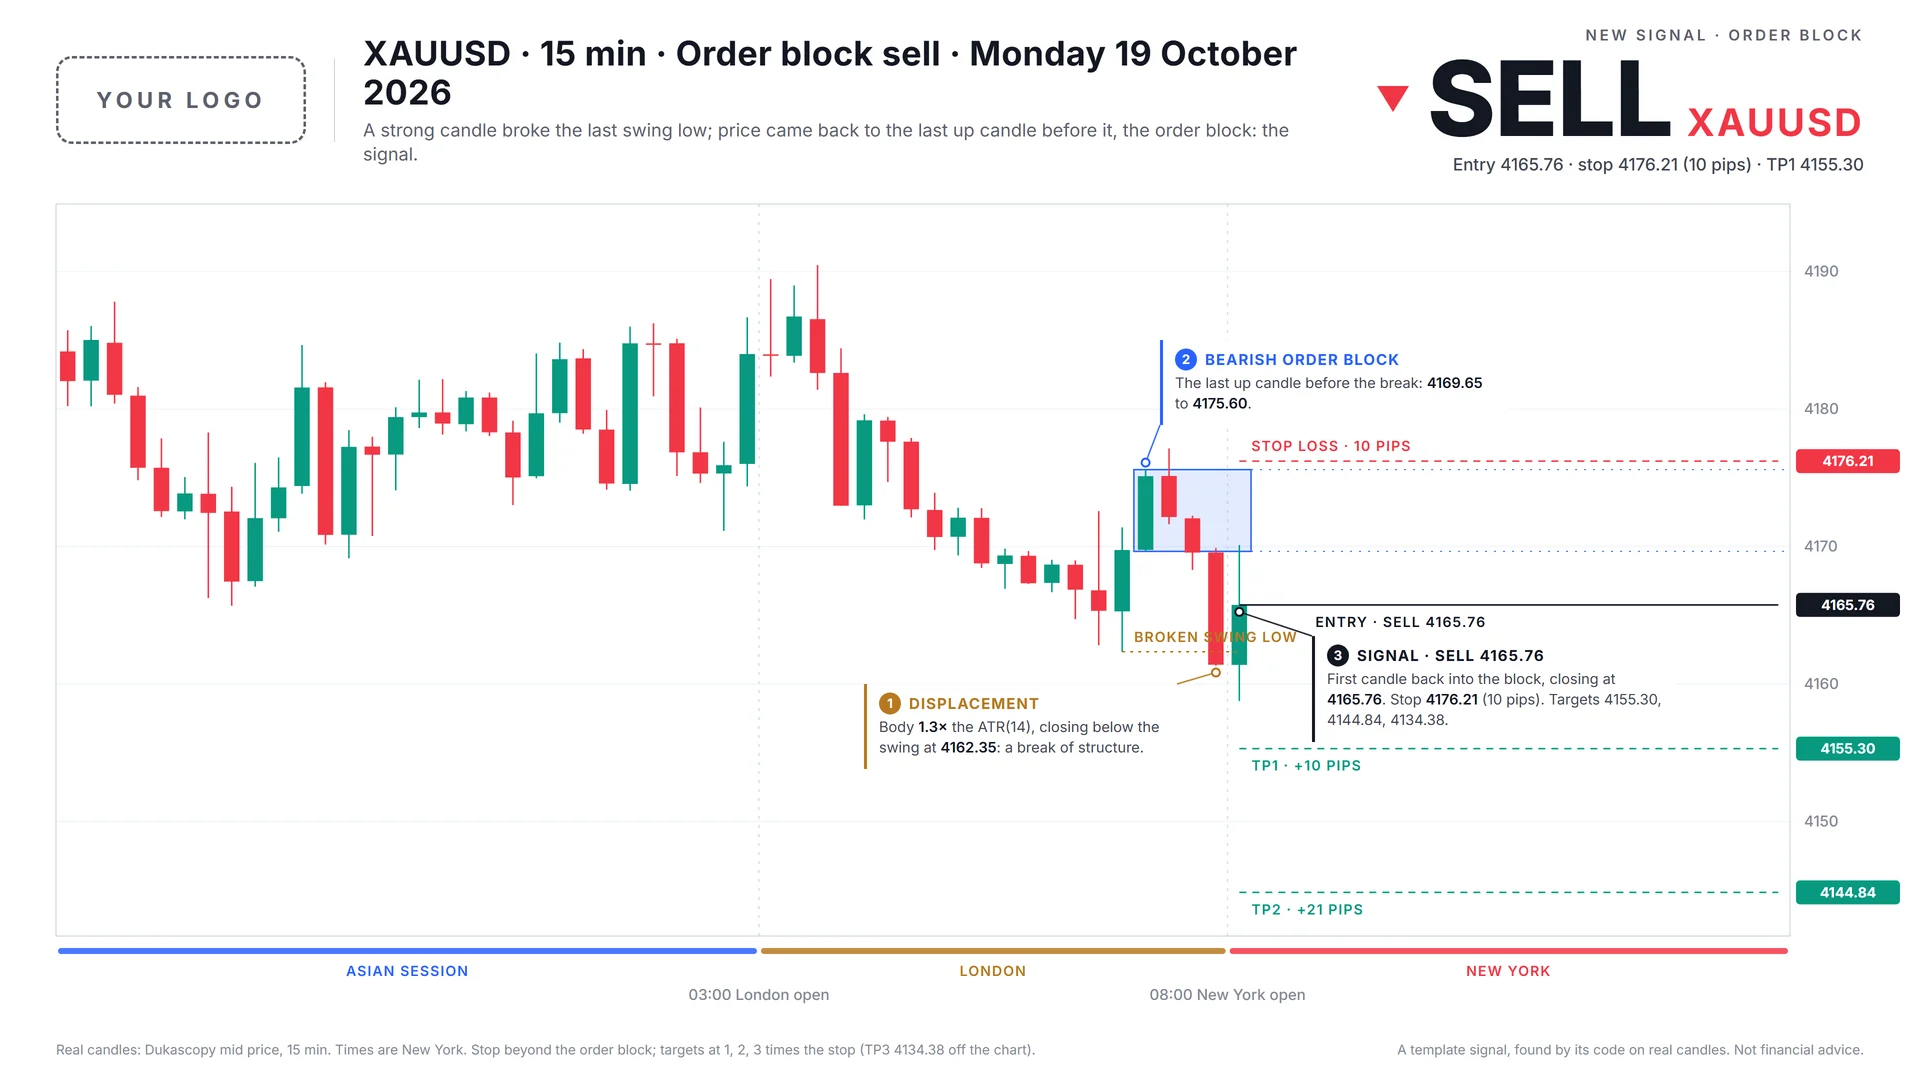
The same signal in another of the bot's chart templates, Daylight, with a space for your logo:
How often it fires
Signals the template's code found with the defaults over the last twelve months of candles. A count of signals, not of wins: we publish no results for templates.
- Gold (XAUUSD)
- 25.7signals a month: 308 from 2025-10-23 to 2026-10-23
- GBPUSD
- 29.8signals a month: 358 from 2025-10-23 to 2026-10-23
Automation, not an edge. A template does the work of watching the chart, finding the setup and posting it. It does not make the strategy win. Before it goes live in your channel we run it over past candles on your markets and show you every signal it would have sent, losses included, privately.
What can be changed
- The rules: every setting above, and any filter or confirmation you can write down.
- The markets: gold and the seven US-dollar majors, one or all of them.
- The chart: your logo where the placeholder is, a chart template in your colours, and the marks your method uses.
- The channels: every signal to a paid channel and a paced share to a free one, the way our own channels run.
Or bring a strategy that is not here: every template started as rules someone wrote down.
Questions
What counts as a displacement?
A candle whose body is at least 1.2 times the average candle range (ATR over 14 candles) and which closes beyond the last swing high, or the last swing low for a sell. A smaller candle, or one that only wicks through the swing, does not count. The size is a setting.
What is a break of structure?
A close beyond the most recent swing high (or low). A swing here is a candle whose high is above the three candles on each side of it. A swing is only used after those three candles have closed, never before.
What if price never comes back to the block?
Then there is no signal. The block must be retraced within 30 candles, and a candle that closes through it first voids it. Most blocks are never traded.
Does the bot place trades?
No. It finds the setup, draws the chart, posts the signal to your Telegram channel and follows it with a reply at each target and at the stop. It does not connect to a broker or trade any account.
Can I change the rules?
Yes. Every setting in the table above is yours to change, and so is anything else that can be written down: a filter, a session, a second confirmation, a different stop. If a step is a judgement call, we work out with you how to write it as a rule.
Will it make money?
We do not say it will, for this template or any other. A template is automation, not an edge. Before it goes live we run it over past candles on your markets and show you every signal it would have sent, losses included, privately. How a strategy behaved on past candles is not what it will do.
Is it AI?
No. It follows the written rules on this page. The same candles always give the same signals.
Which markets and timeframes?
The seven US-dollar majors and gold today, on any timeframe from 5 minutes to daily. Other markets need a price feed for them first; ask us.
What does it cost?
Templates are in early access: built with you, for your channel, and priced before launch. Early-access members hear the price first. For a broker, prop firm or educator, write to us.
Other strategy templates
Opening range breakout
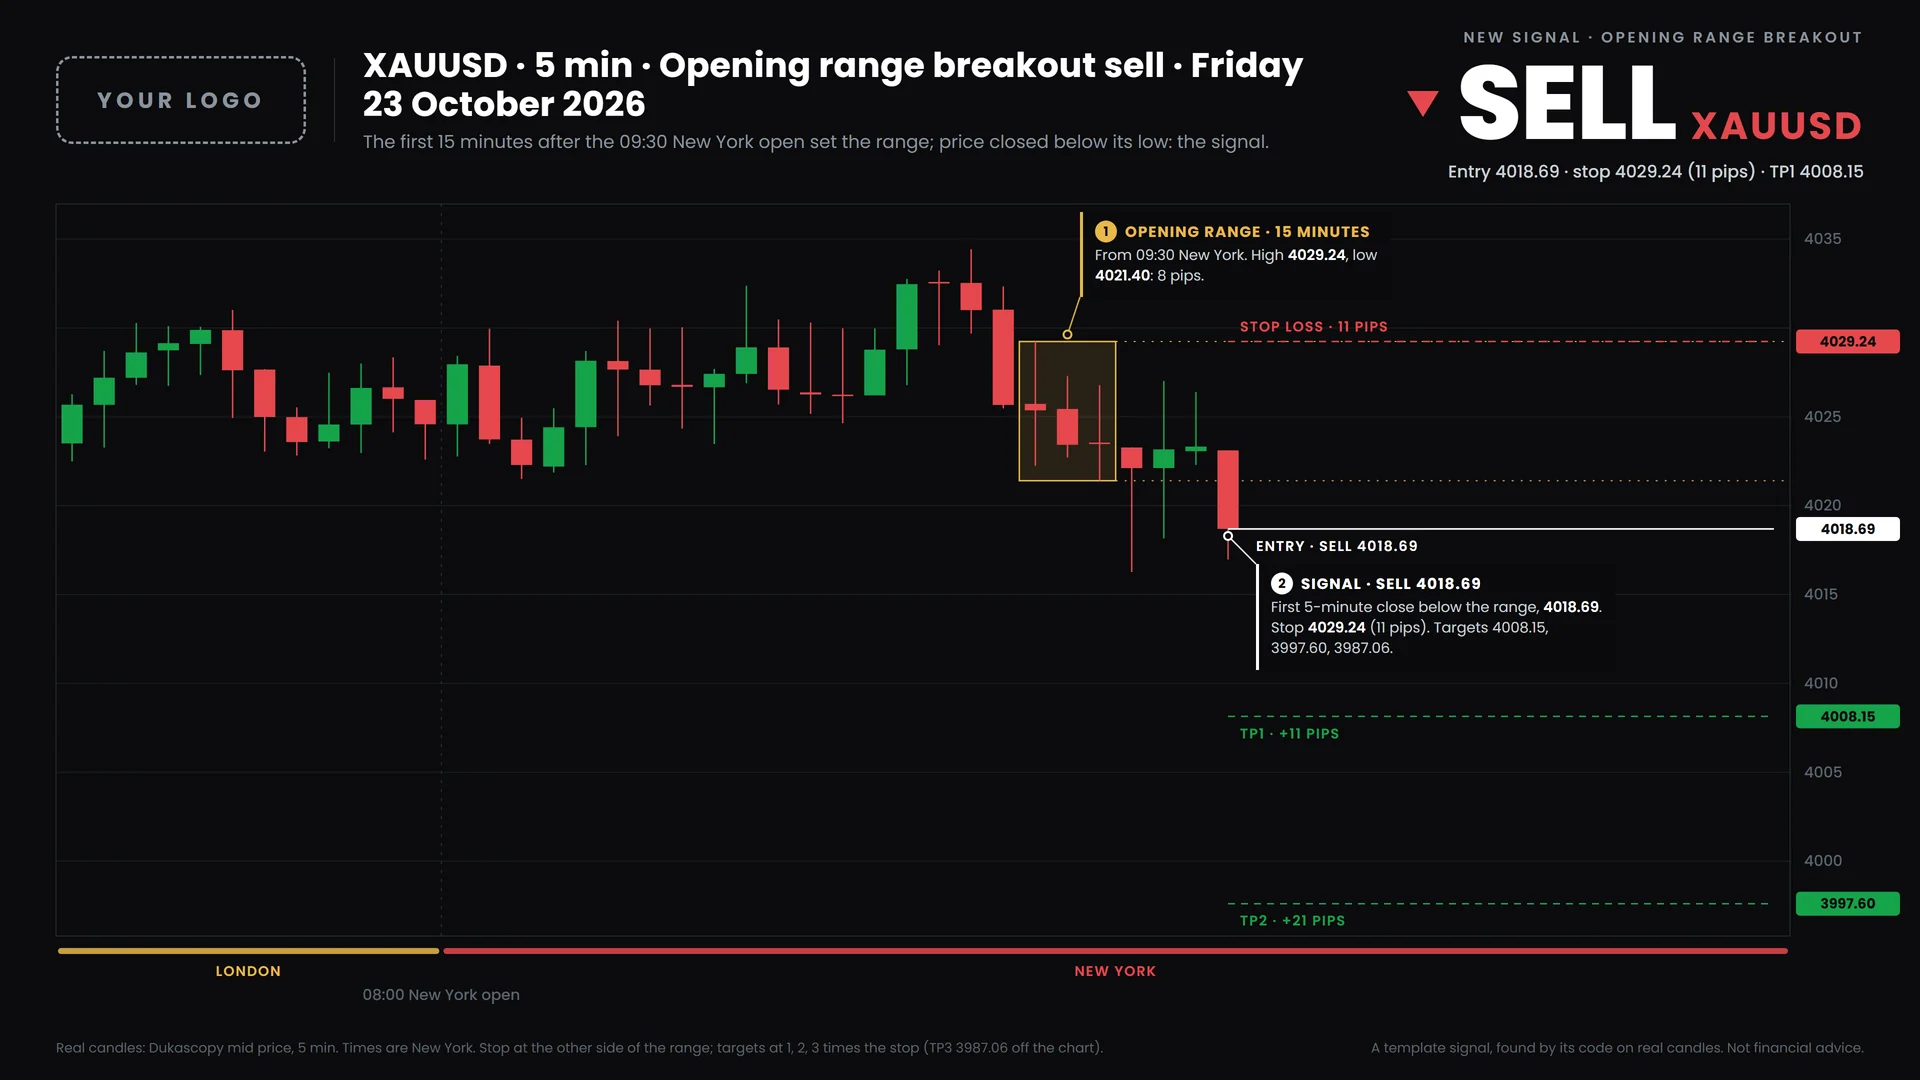
The first 15 minutes after the New York open set a range; the first 5-minute close outside it is the signal.
Fair value gap
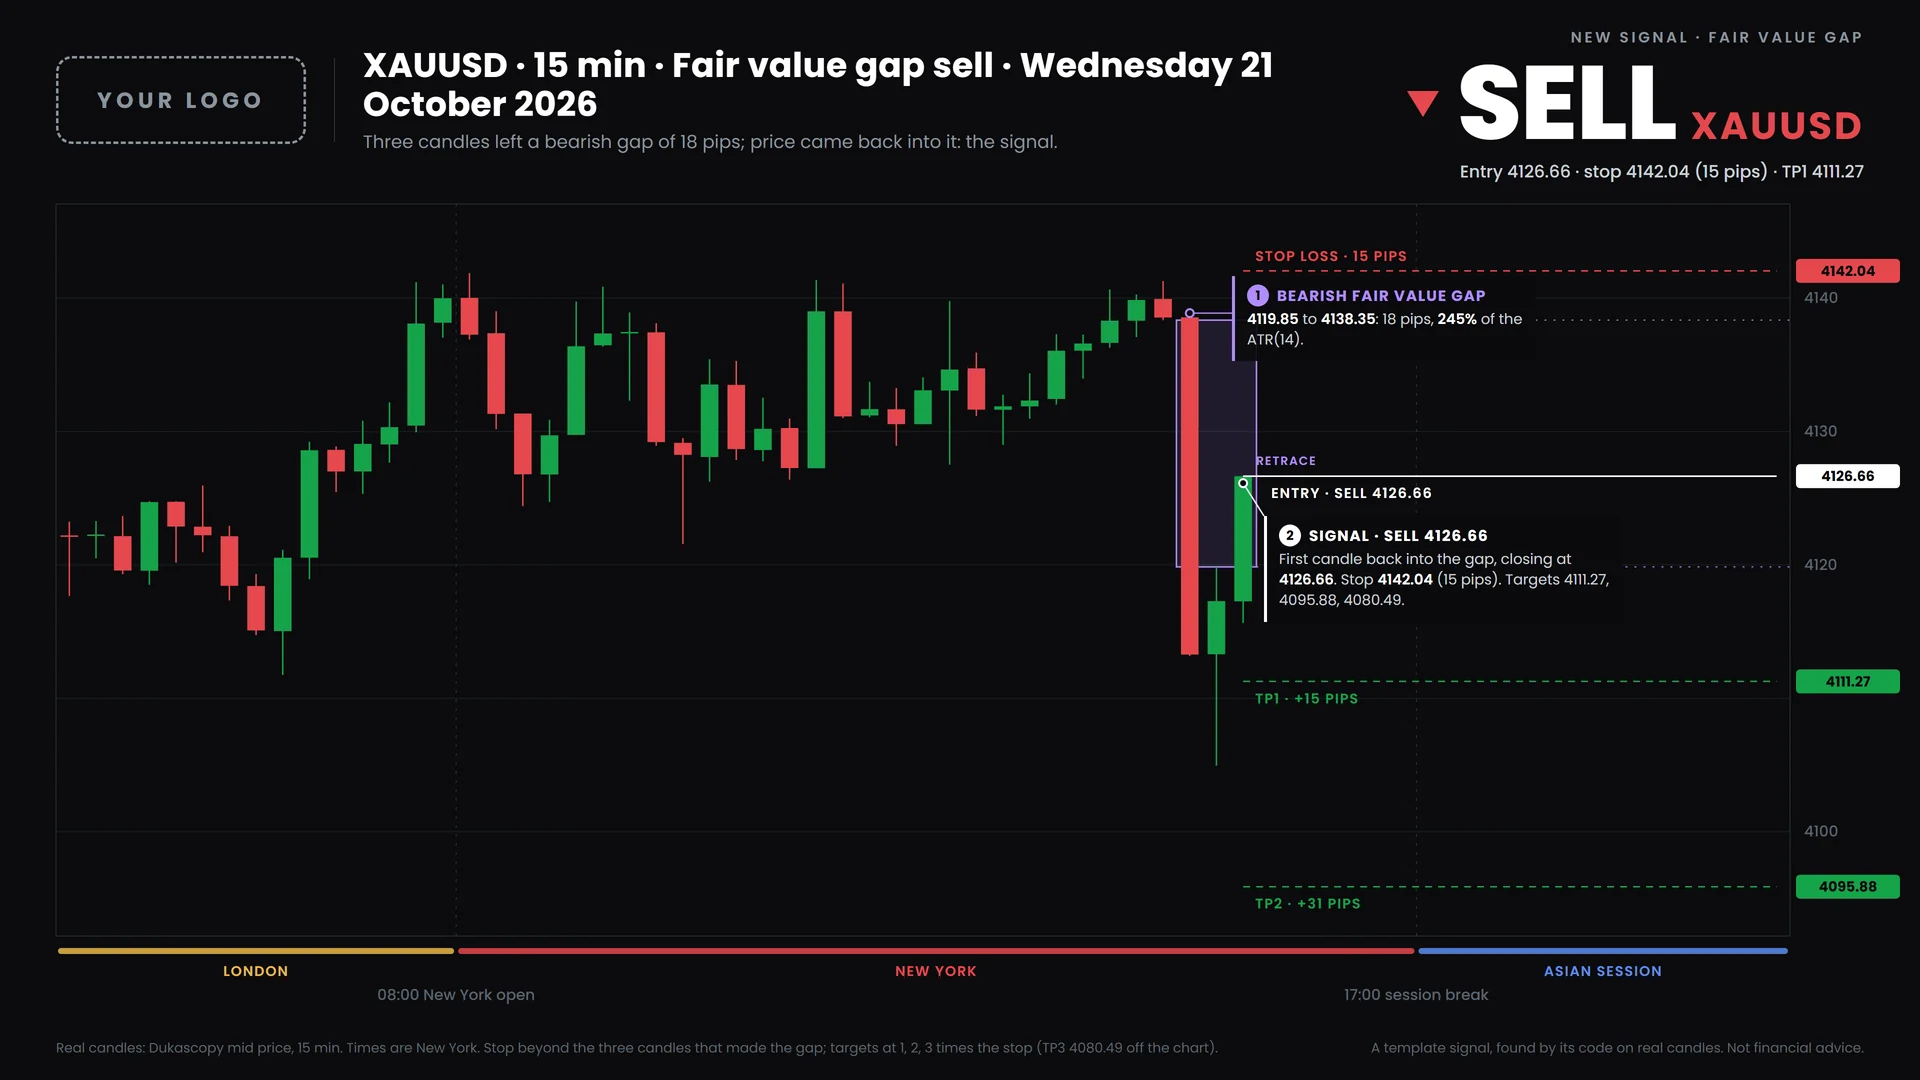
Three candles leave a gap that price skipped; the first candle to come back into it is the signal.
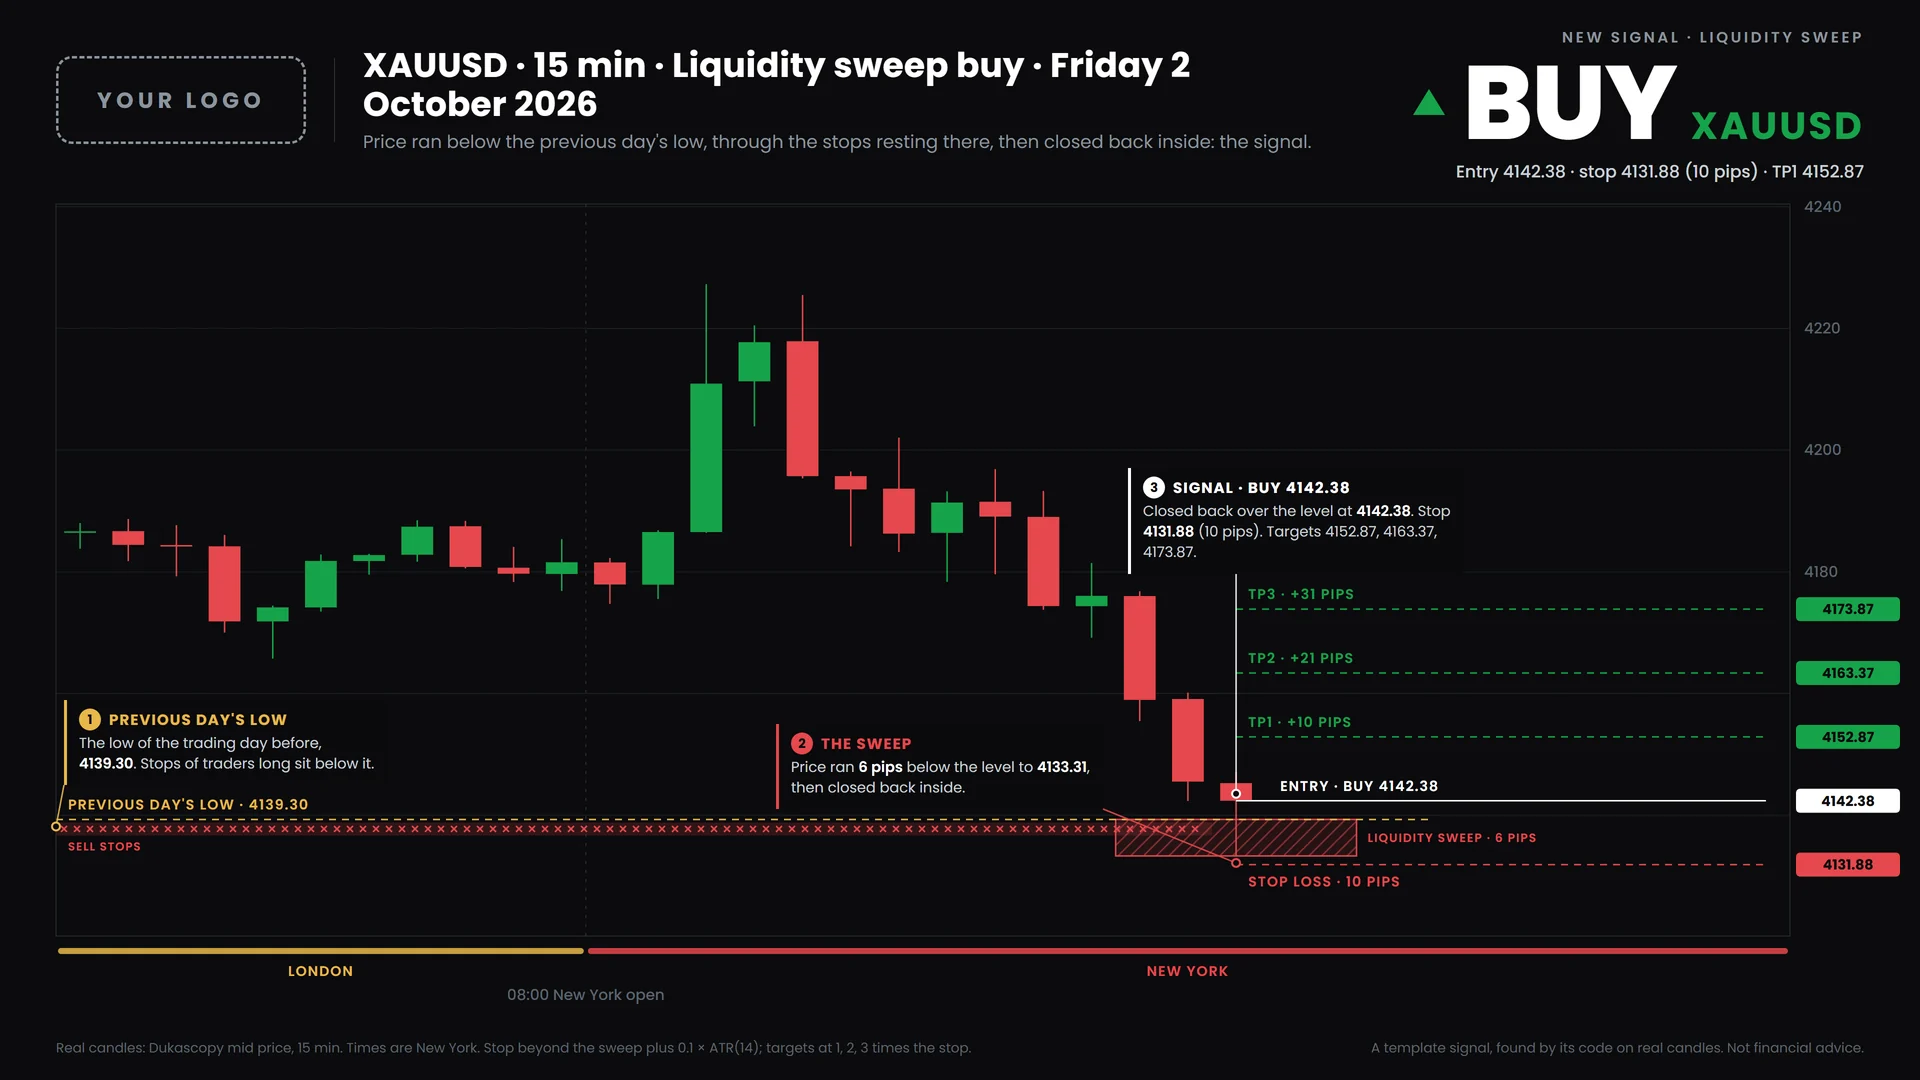
Liquidity sweep
Price runs through the previous day's high or low, then a 15-minute candle closes back inside the level: that close is the signal.
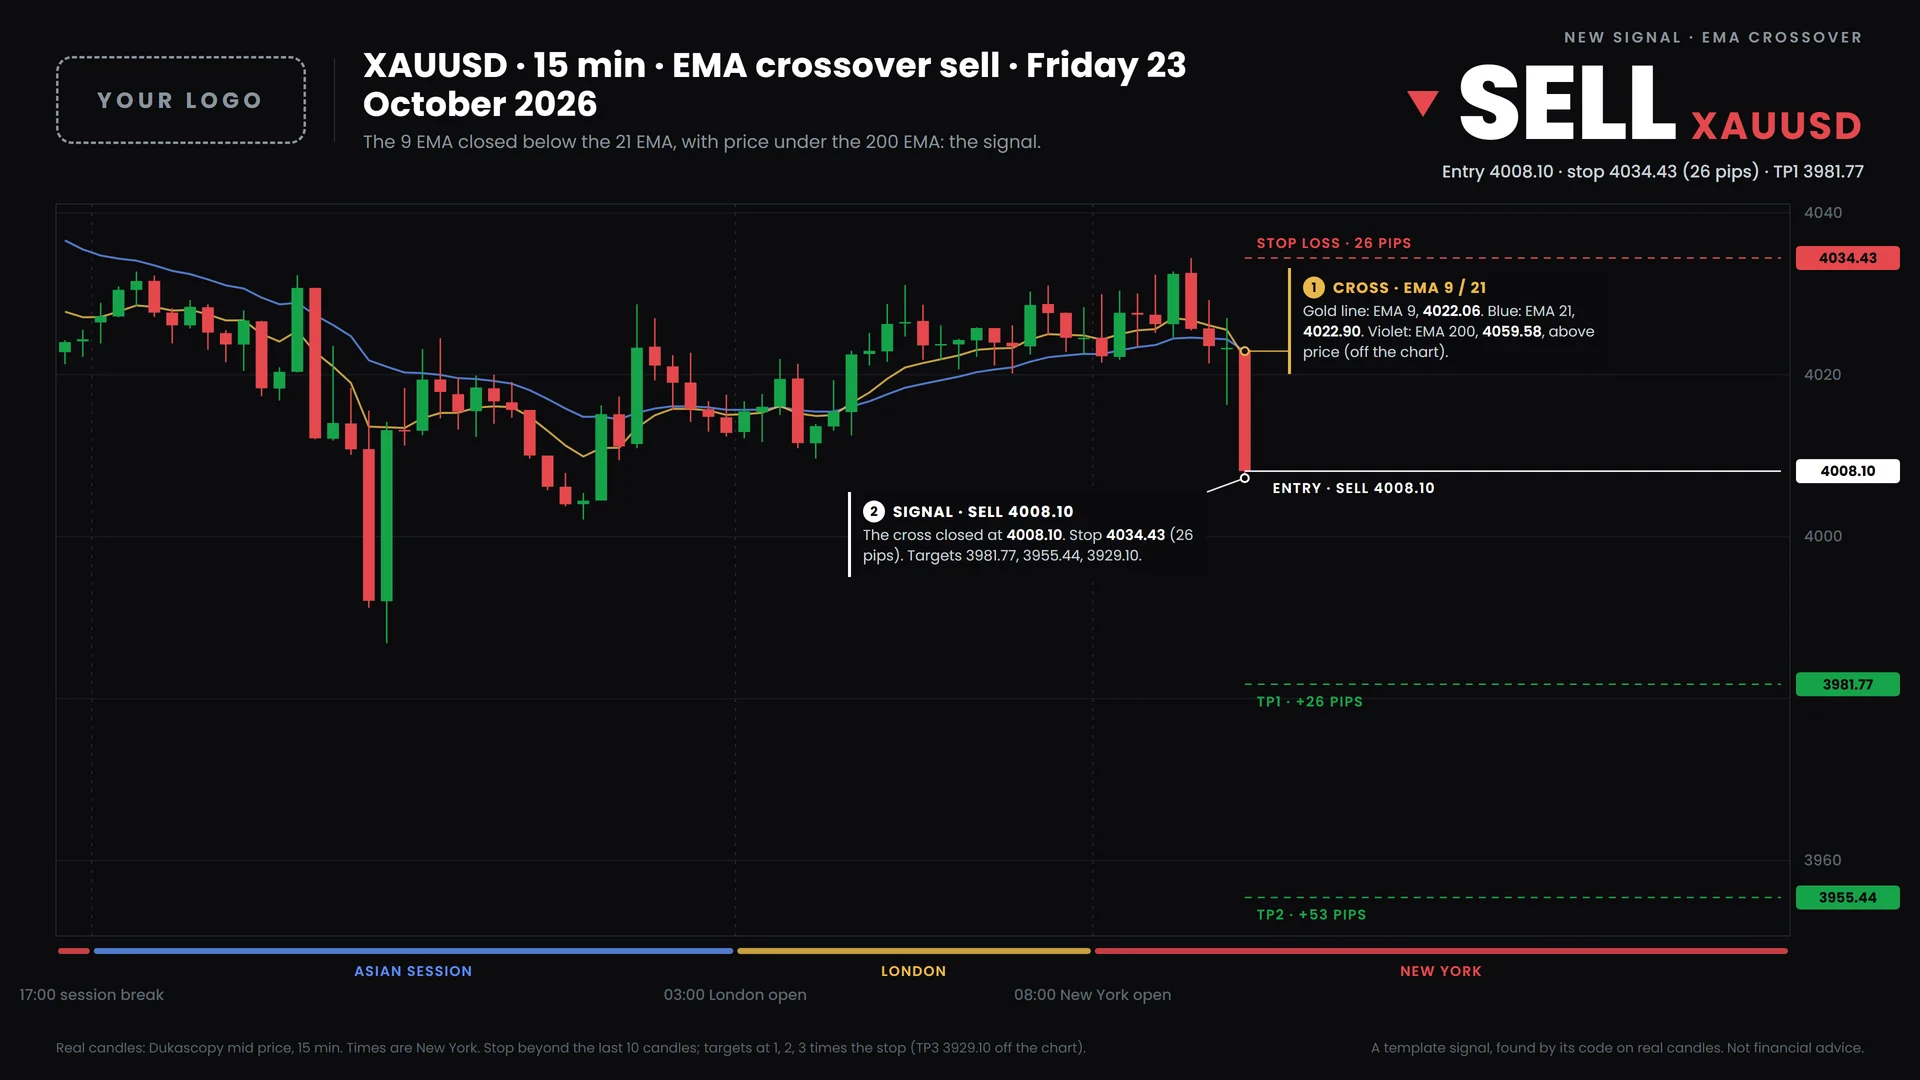
EMA crossover
The 9 EMA closes across the 21 EMA in the direction of the 200 EMA: a buy above it, a sell below it.
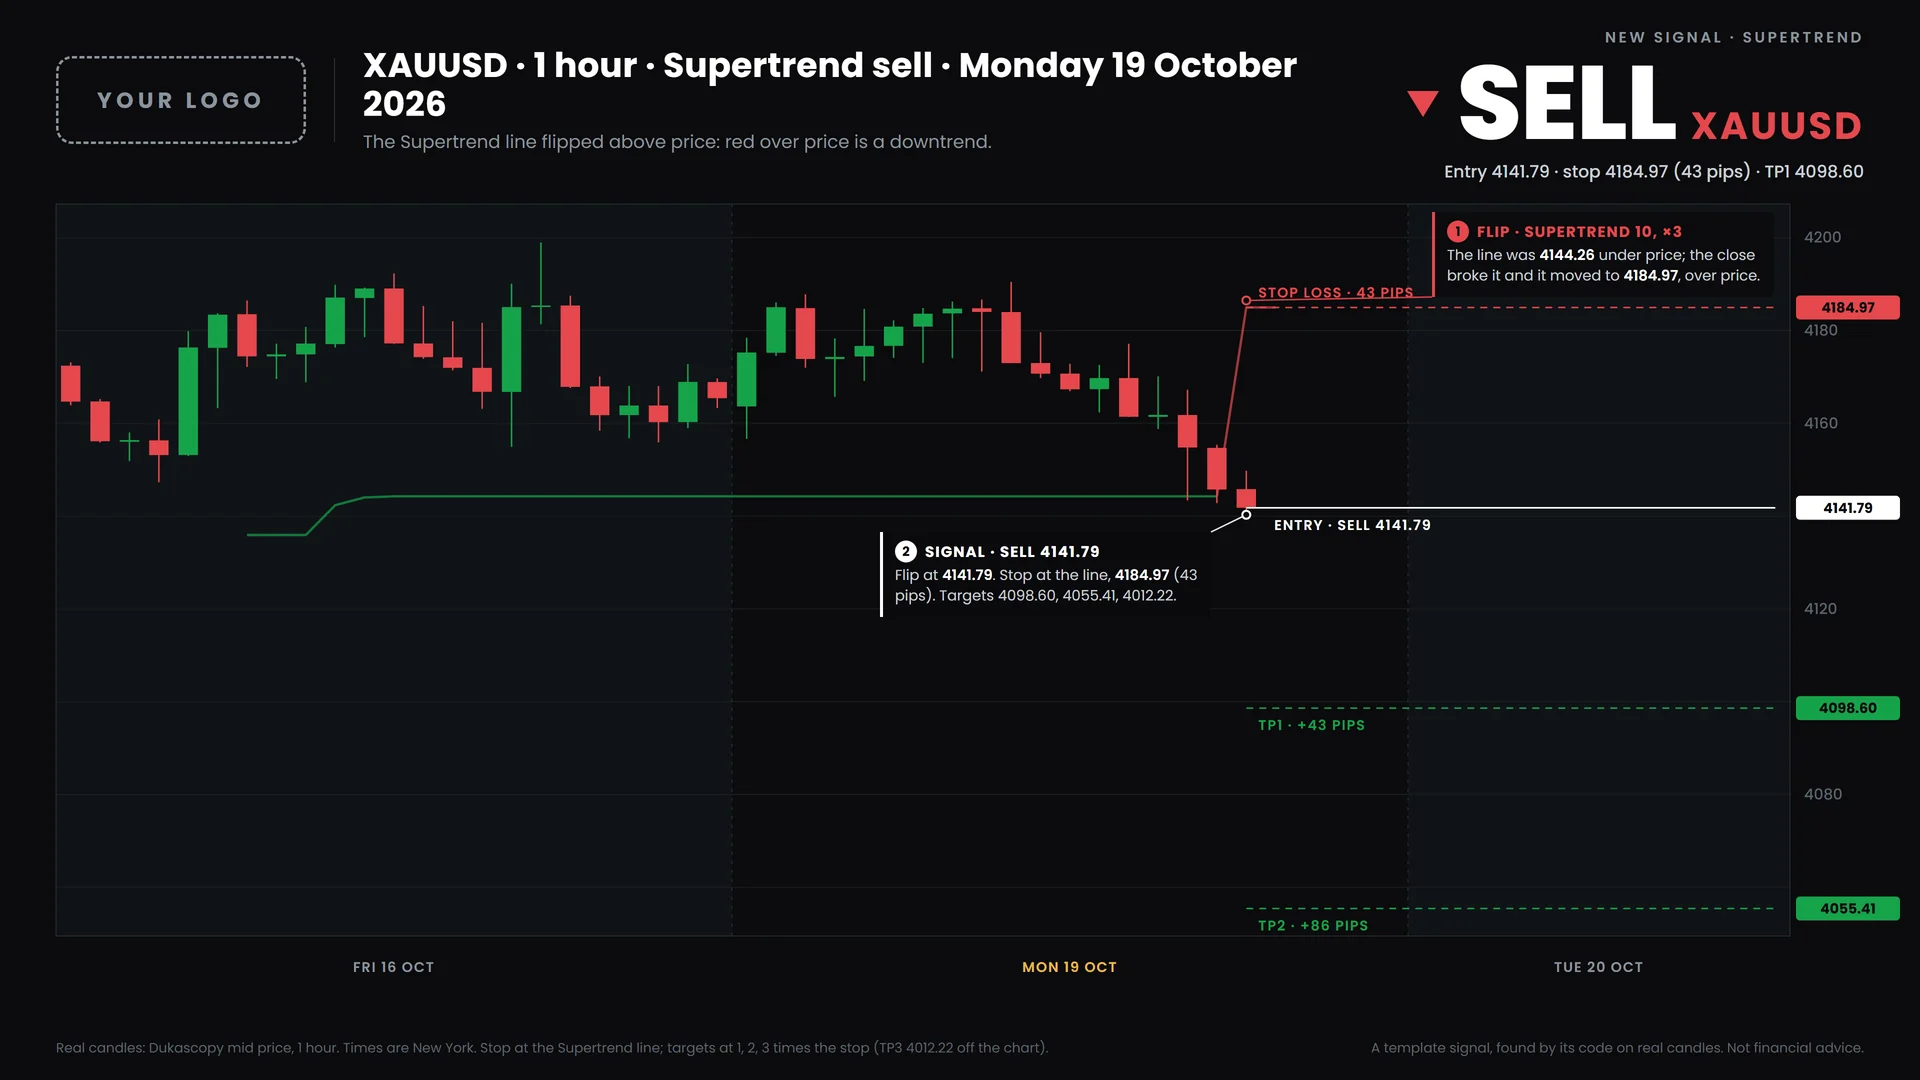
Supertrend
The Supertrend line (ATR 10 × 3) flips from above price to below it, or the other way: the candle that closes through it is the signal.
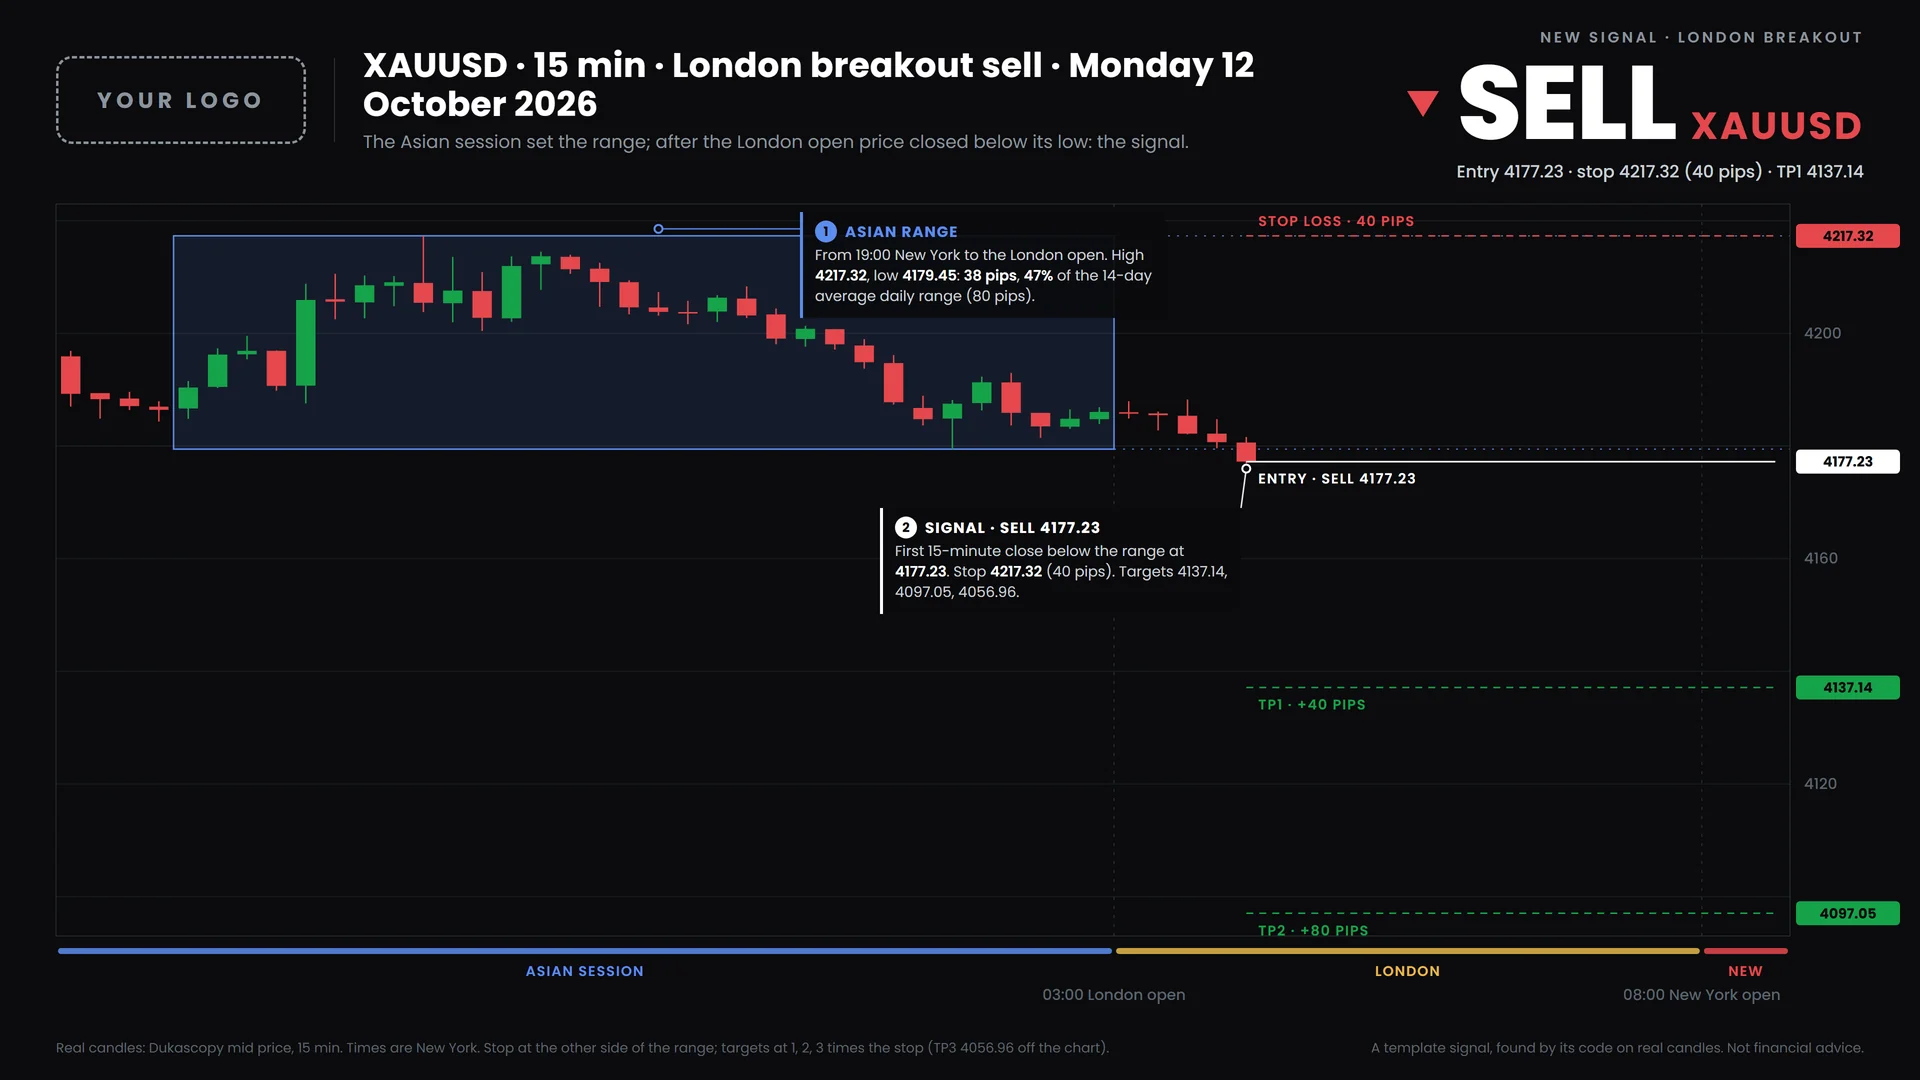
London breakout
The Asian session sets a range; the first 15-minute close above its high or below its low after the London open is the signal.
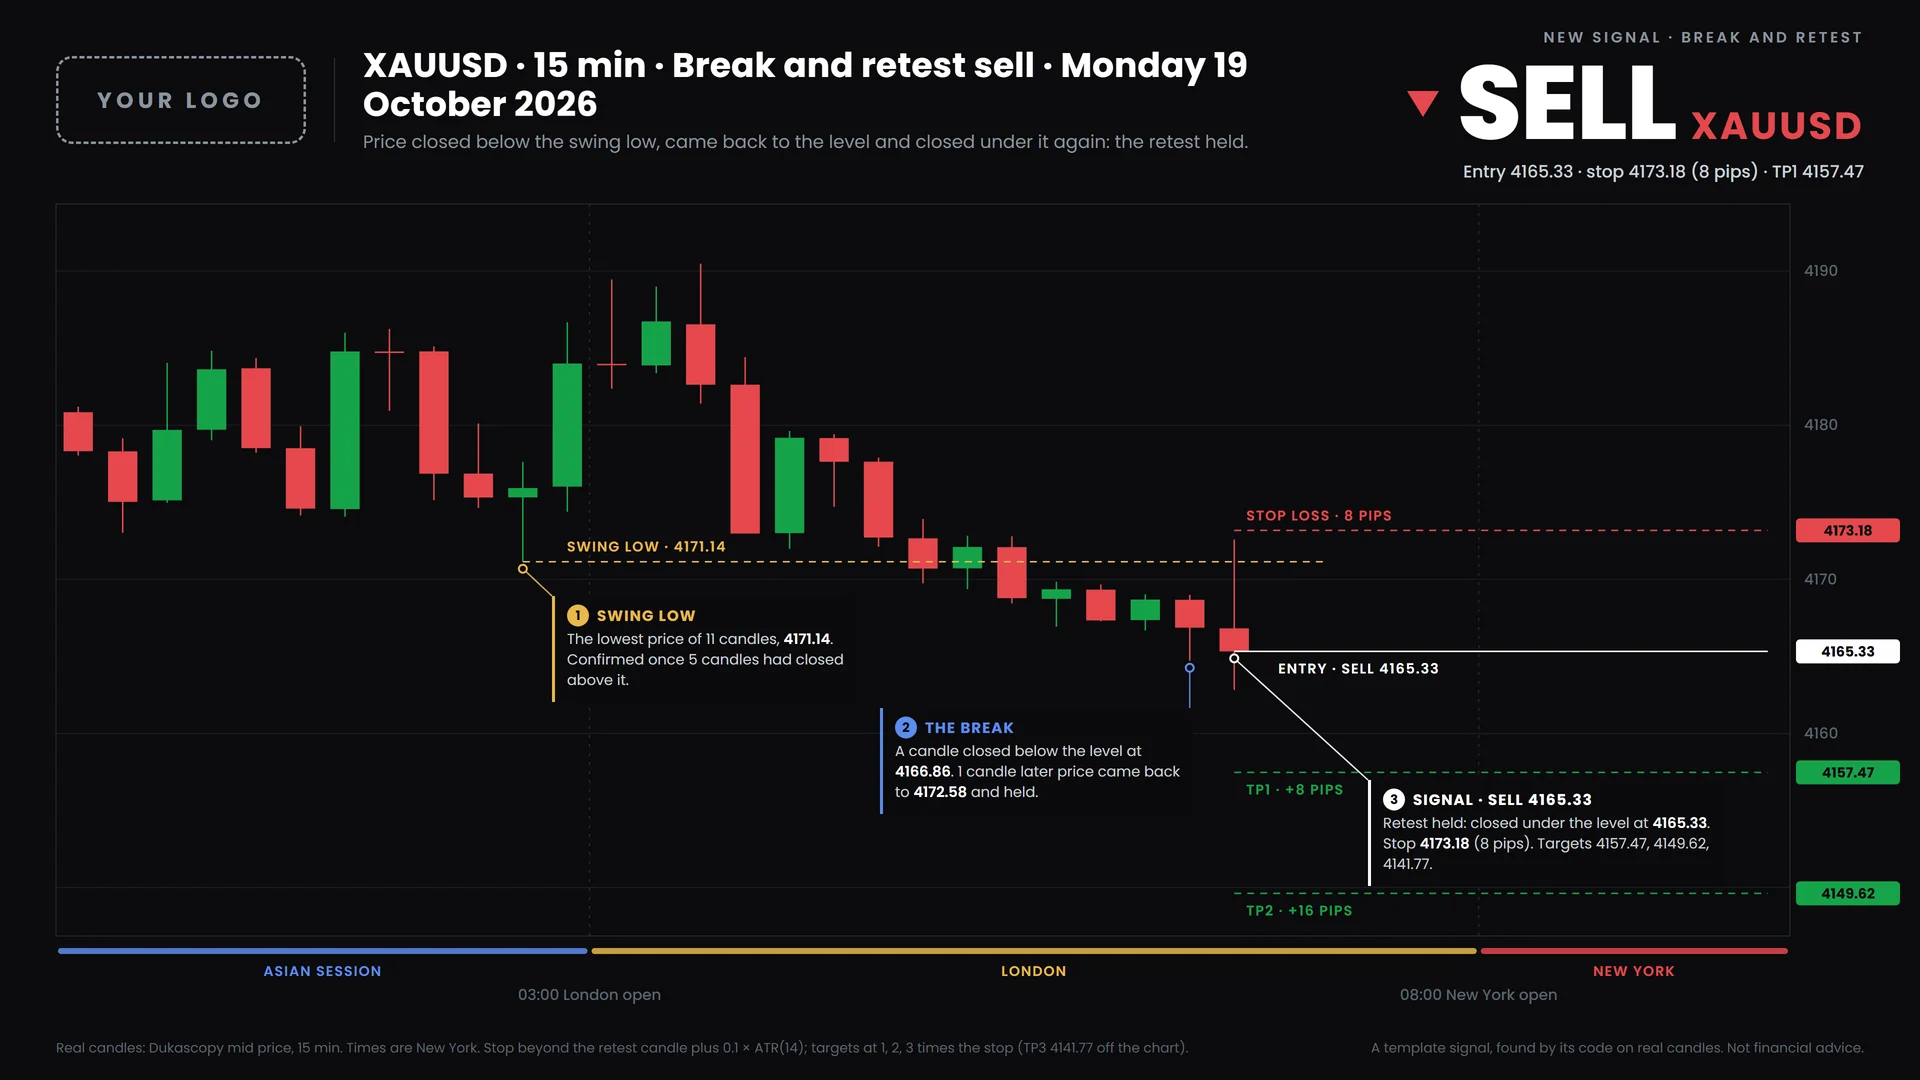
Break and retest
Price closes beyond a swing high or low, comes back to the level within twelve candles and closes on the broken side: that close is the signal.
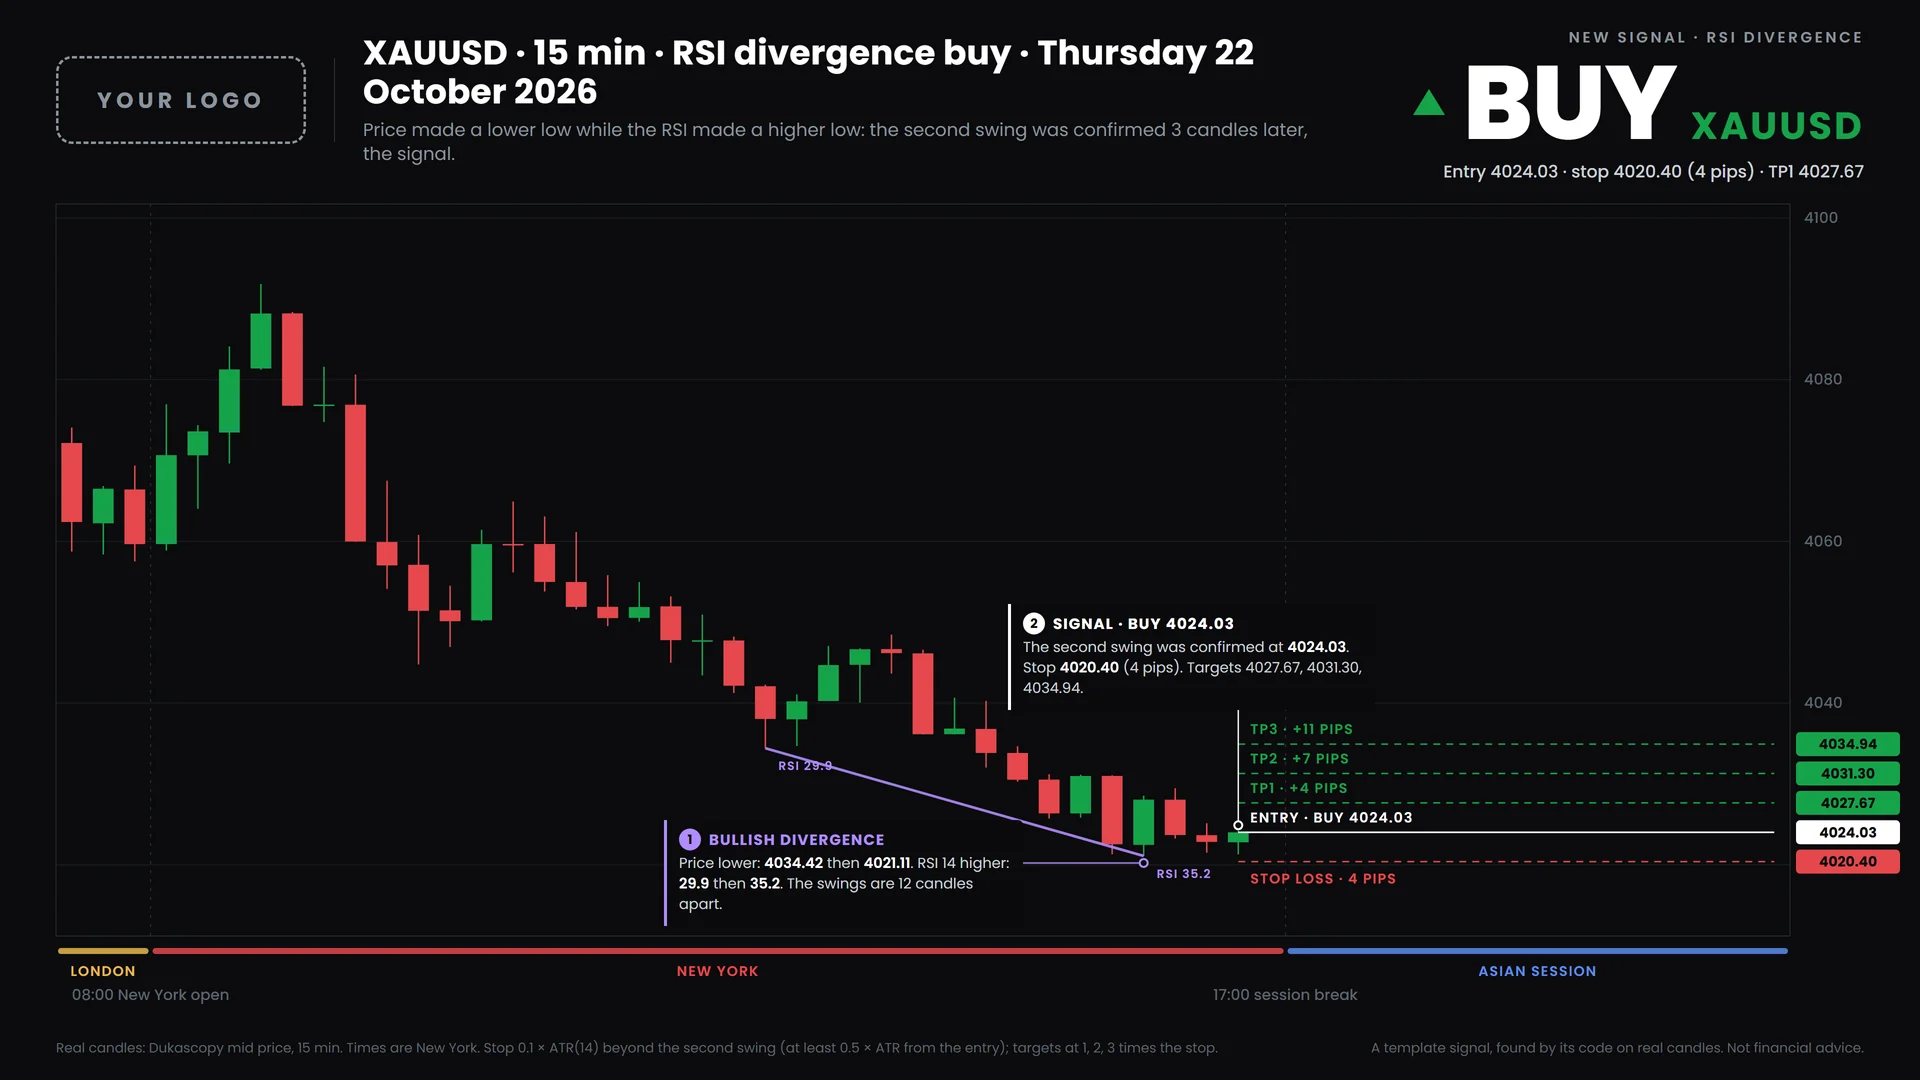
RSI divergence
Price makes a lower swing low while the RSI makes a higher one, the first in oversold territory: a buy once the second swing is confirmed. The mirror is a sell.
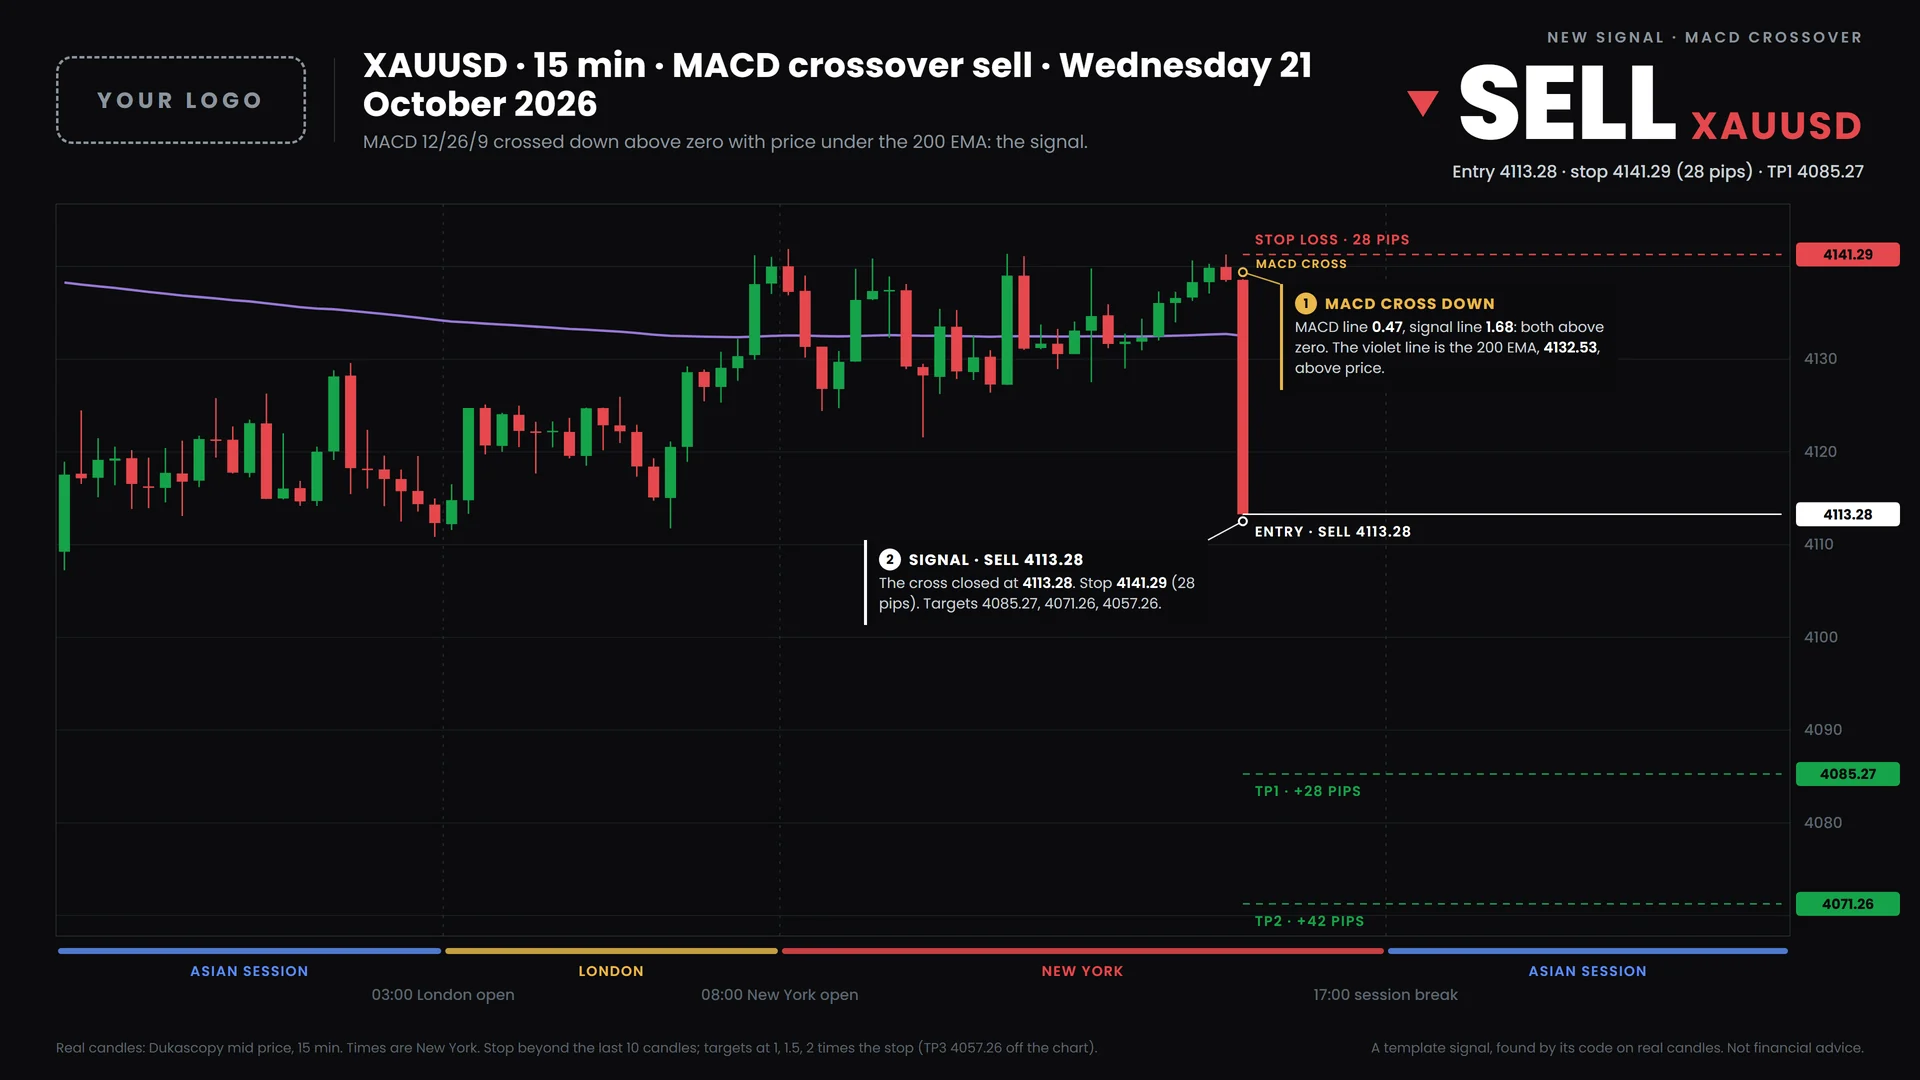
MACD crossover
The MACD line crosses its signal line below zero in an uptrend, or above zero in a downtrend, with price on the 200 EMA's side.
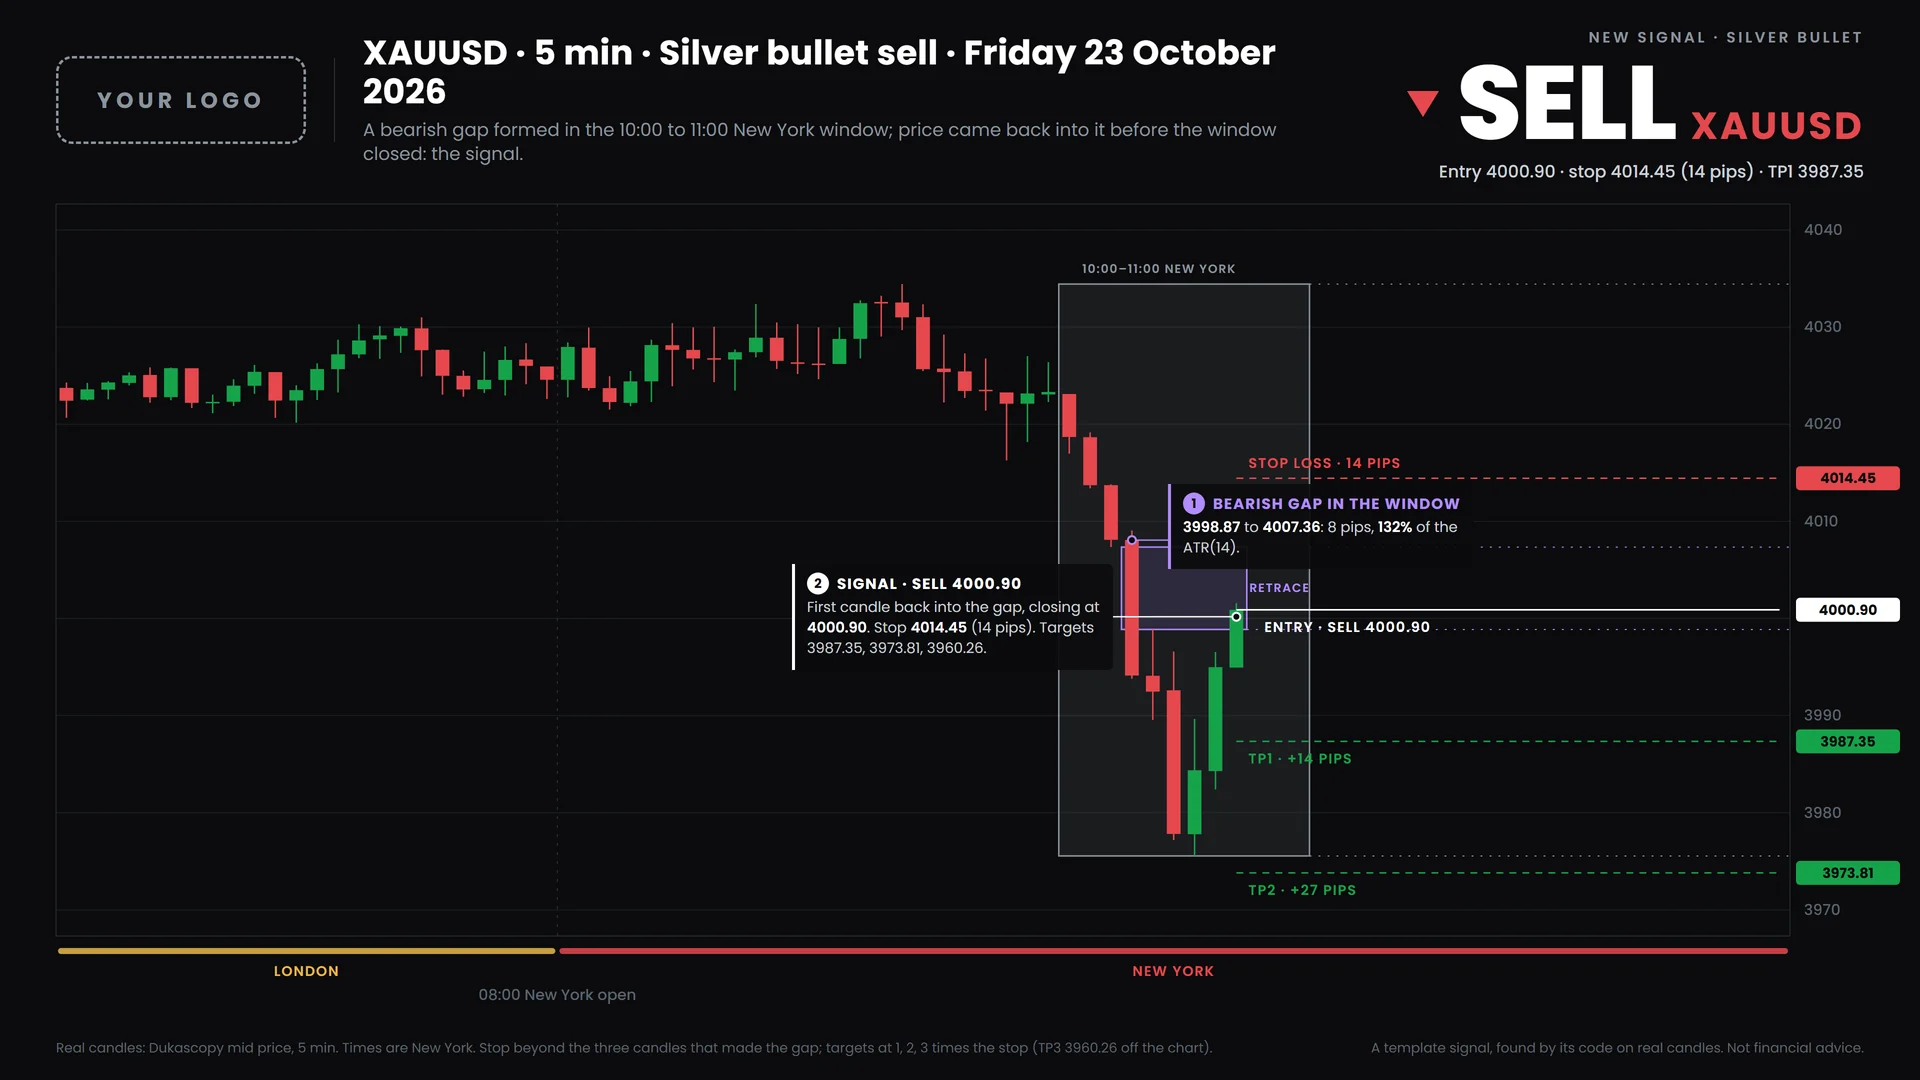
Silver bullet
A fair value gap forms in the 10:00 to 11:00 New York window; the first candle back into it before 11:00 is the signal.
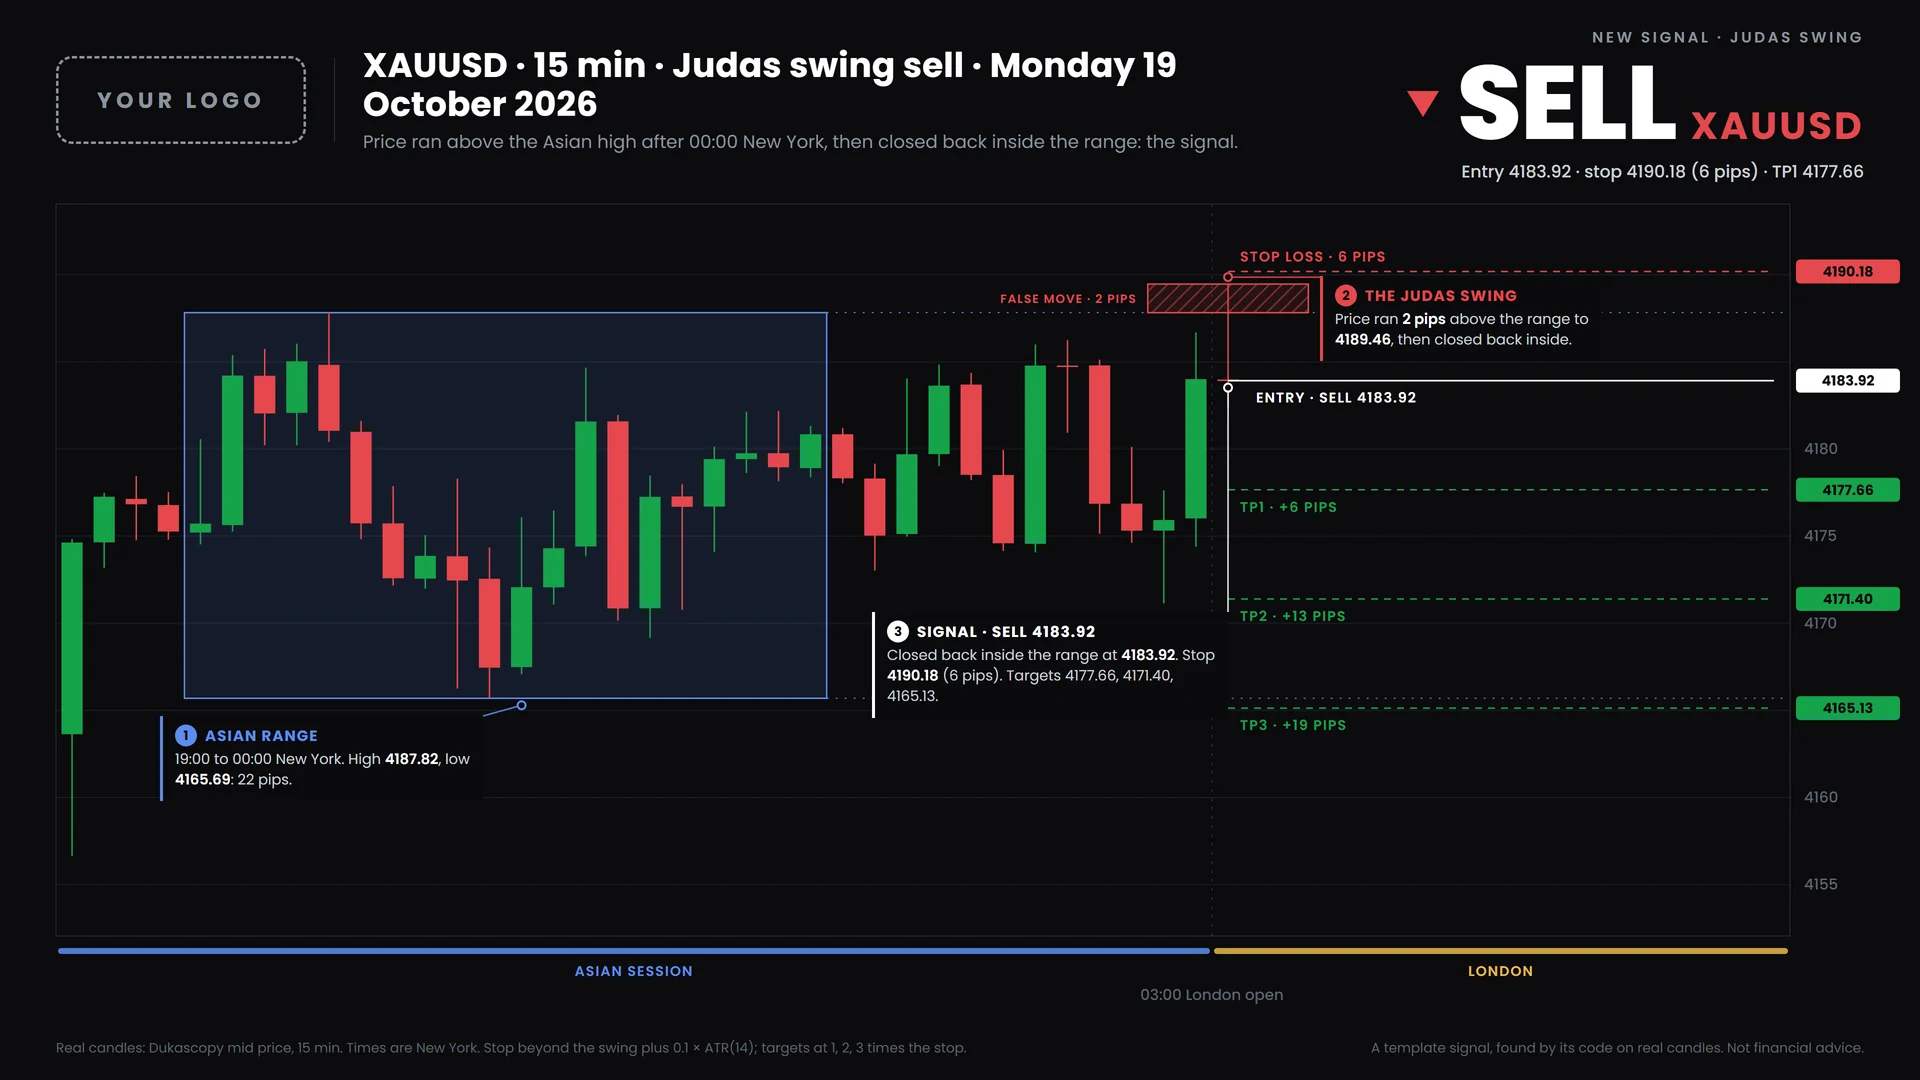
Judas swing
A candle runs through the Asian range early in London, then a 15-minute candle closes back inside it: that close is the signal.