Strategy template · early access
RSI divergence strategy, automated
Price makes a lower swing low while the RSI makes a higher one, the first in oversold territory: a buy once the second swing is confirmed. The mirror is a sell. The bot runs it on real candles, draws each signal and posts it to your Telegram channel, built with you in early access.
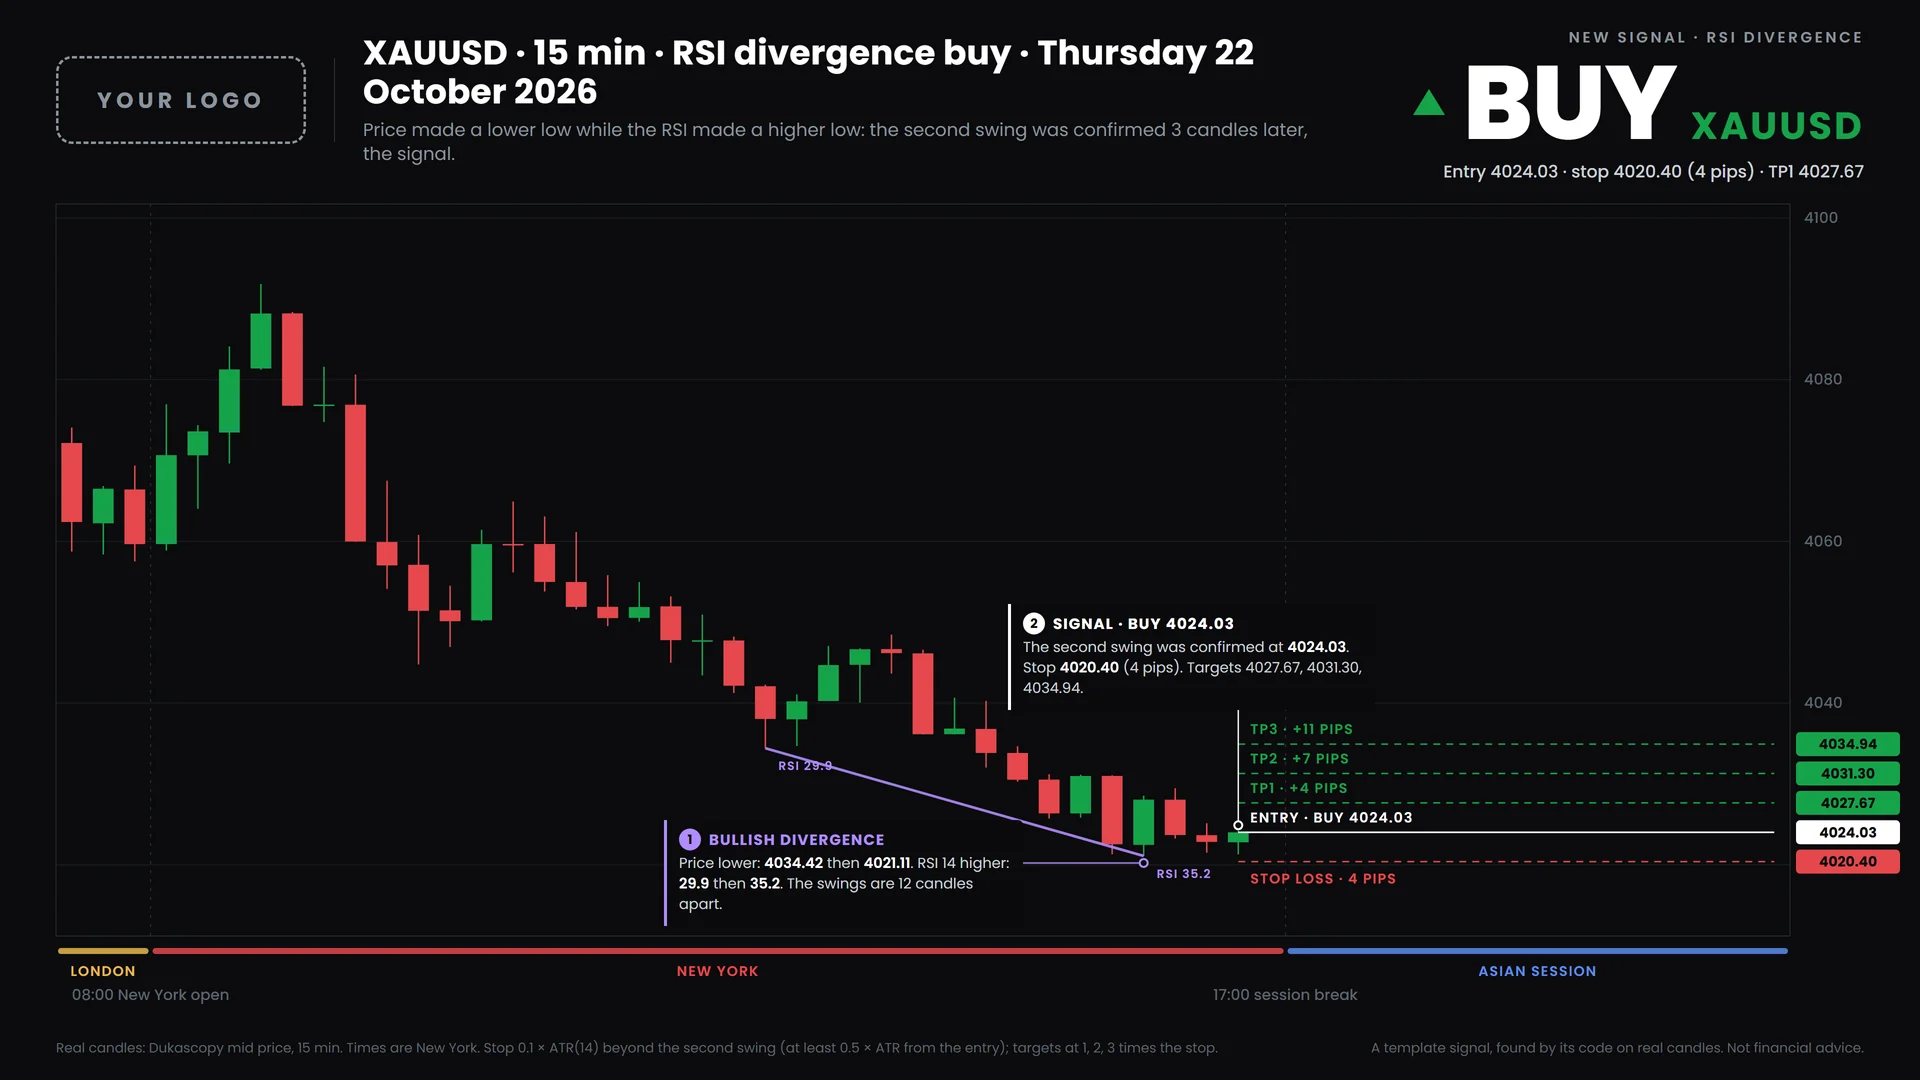
What the rsi divergence is
The relative strength index (RSI), which J. Welles Wilder introduced in 1978, measures how strongly price has been moving over the last 14 candles on a scale of 0 to 100. A divergence is a disagreement between price and that reading. In a regular bullish divergence price makes a lower low but the RSI makes a higher low: the move down is carrying less momentum than the one before, and traders read that as selling running out of force. A bearish divergence is the same thing at highs.
Divergence is the hardest of the common indicator setups to write down, because the eye finds it so easily and rules for it vary. The version here is fixed by numbers: swing points confirmed by three candles each side, a set distance between them, an RSI level for the first one, and a signal only once the second swing is confirmed.
The bot's rules
- Swing points are candles whose low (high) is beaten by none of the 3 before and 3 after; a swing is used only once those 3 candles have closed.
- Bullish: the two most recent swing lows are 5 to 40 candles apart, the second lower in price and at least 2 points higher in RSI 14, with the RSI at the first at 35 or under. Buy on the close that confirms the second.
- Bearish: the mirror, with swing highs, a higher price high and a lower RSI high, the RSI at the first at 65 or over. Sell on the close that confirms the second.
- Stop 0.1 × ATR(14) beyond the second swing, and at least 0.5 × ATR(14) from the entry. Targets at 1, 2, 3 times the stop distance. Each pair of swings once.
Which version. Regular divergence on RSI 14 and swing points, as it is usually taught: the two most recent swing lows (or highs) between 5 and 40 candles apart, the first with the RSI at 35 or under (65 or over), the stop beyond the second swing.
The settings
The defaults the example was found with. Each one is a setting, not a rewrite.
| Setting | Default | What you can change |
|---|---|---|
| Market | XAUUSD | Gold or any of the seven US-dollar majors; other markets need a price feed first. |
| Candles | 15 minutes | The RSI and the swings are read on these. |
| RSI length | 14 candles | 14 is the default. |
| Swing: candles before | 3 candles | A swing low is lower than this many candles before it. |
| Swing: candles after | 3 candles | And this many after; the signal waits for them. |
| Swings at least | 5 candles apart | Closer than this and the two are one move. |
| Swings at most | 40 candles apart | Further apart and the comparison is stale. |
| Buy: RSI at the first low | 35 or under | 30 and 40 are also taught. |
| RSI difference | 2 points or more | How far the RSI at the second swing must be from the first; 0 takes any difference. |
| Sell: RSI at the first high | 65 or over | 70 and 60 are also taught. |
| Smallest stop | 0.5 × ATR(14) | The swing is often close to the entry by the time it is confirmed; the stop is pushed out to at least this. |
| Stop margin | 0.1 × ATR(14) | Past the second swing, so a wick on it is not the stop. |
| Targets | 1, 2, 3 × the stop | Or the swing that started the move. |
The example, as the bot would post it
The signal in the chart above: found by the template's code on XAUUSD 15 min candles at . Its levels, and the message the bot would send with the chart:
- Entry4024.03
- Stop4020.40 · 4 pips
- TP14027.67 · +4 pips
- TP24031.30 · +7 pips
- TP34034.94 · +11 pips
🟢 BUY XAUUSD · RSI divergence

Entry: 4024.03 (market)
Stop: 4020.40 (4 pips)
TP1: 4027.67 (+4 pips)
TP2: 4031.30 (+7 pips)
TP3: 4034.94 (+11 pips)

Bullish RSI divergence: price made a lower low, the RSI a higher low (29.9 then 35.2). Stop beyond the second swing; targets at 1, 2, 3 times the stop.

Not financial advice. Trade at your own risk.
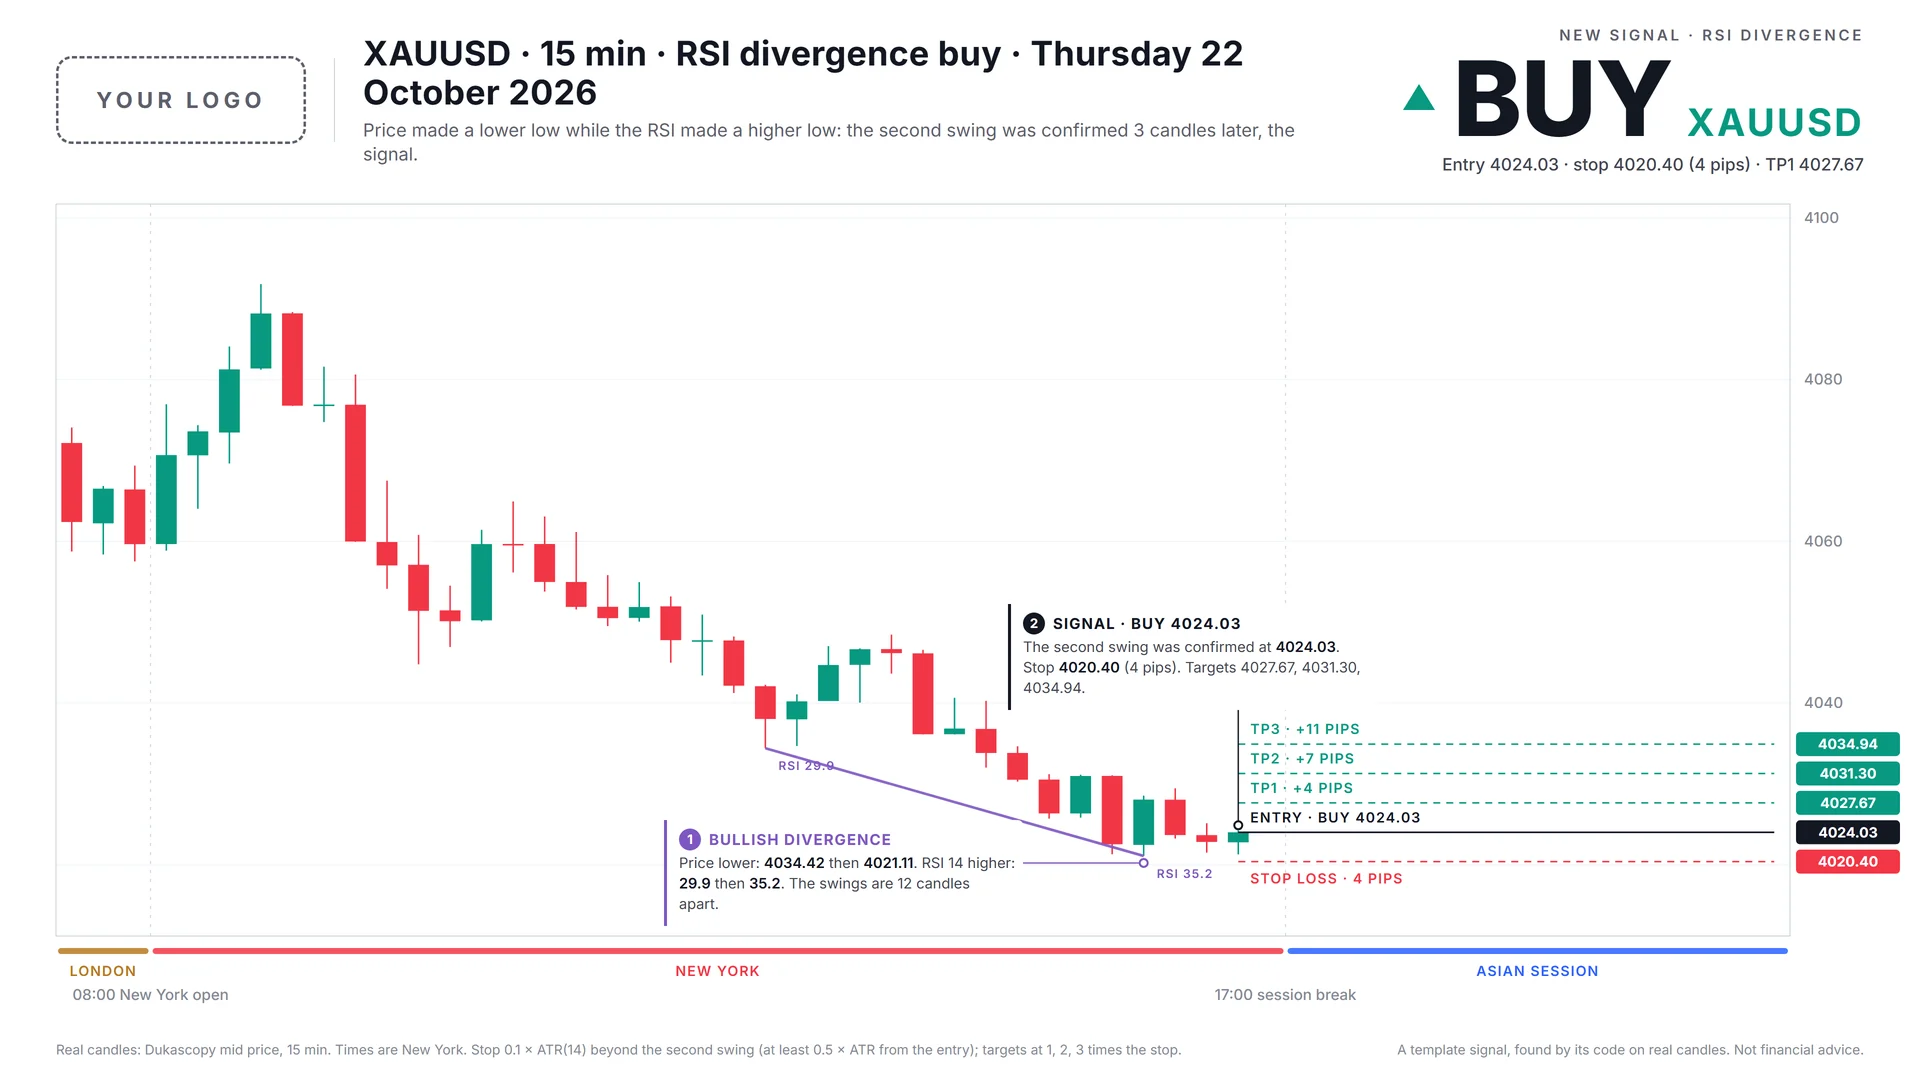
The same signal in another of the bot's chart templates, Daylight, with a space for your logo:
How often it fires
Signals the template's code found with the defaults over the last twelve months of candles. A count of signals, not of wins: we publish no results for templates.
- Gold (XAUUSD)
- 13signals a month: 156 from 2025-10-23 to 2026-10-23
- GBPUSD
- 13.1signals a month: 157 from 2025-10-23 to 2026-10-23
Automation, not an edge. A template does the work of watching the chart, finding the setup and posting it. It does not make the strategy win. Before it goes live in your channel we run it over past candles on your markets and show you every signal it would have sent, losses included, privately.
What can be changed
- The rules: every setting above, and any filter or confirmation you can write down.
- The markets: gold and the seven US-dollar majors, one or all of them.
- The chart: your logo where the placeholder is, a chart template in your colours, and the marks your method uses.
- The channels: every signal to a paid channel and a paced share to a free one, the way our own channels run.
Or bring a strategy that is not here: every template started as rules someone wrote down.
Questions
When does the signal come?
Not at the second low. A swing low is only a swing low once three candles on its right are higher, so the bot sends the signal on the close of that third candle, never earlier. That delay is the price of not repainting: the signal it sends is the one that stays on the chart.
Why does the first low need an RSI of 35 or under?
Most versions of the rule want the first swing stretched. The oversold (or overbought, 65 or over) level keeps the bot to stretched moves. It is a setting; set it to 100 for a buy to take every divergence.
What about hidden divergence?
This template is regular divergence only, a reversal setup. Hidden divergence, a continuation setup, is another set of rules, and the bot can run it too.
Does the bot place trades?
No. It finds the setup, draws the chart, posts the signal to your Telegram channel and follows it with a reply at each target and at the stop. It does not connect to a broker or trade any account.
Can I change the rules?
Yes. Every setting in the table above is yours to change, and so is anything else that can be written down: a filter, a session, a second confirmation, a different stop. If a step is a judgement call, we work out with you how to write it as a rule.
Will it make money?
We do not say it will, for this template or any other. A template is automation, not an edge. Before it goes live we run it over past candles on your markets and show you every signal it would have sent, losses included, privately. How a strategy behaved on past candles is not what it will do.
Is it AI?
No. It follows the written rules on this page. The same candles always give the same signals.
Which markets and timeframes?
The seven US-dollar majors and gold today, on any timeframe from 5 minutes to daily. Other markets need a price feed for them first; ask us.
What does it cost?
Templates are in early access: built with you, for your channel, and priced before launch. Early-access members hear the price first. For a broker, prop firm or educator, write to us.
Other strategy templates
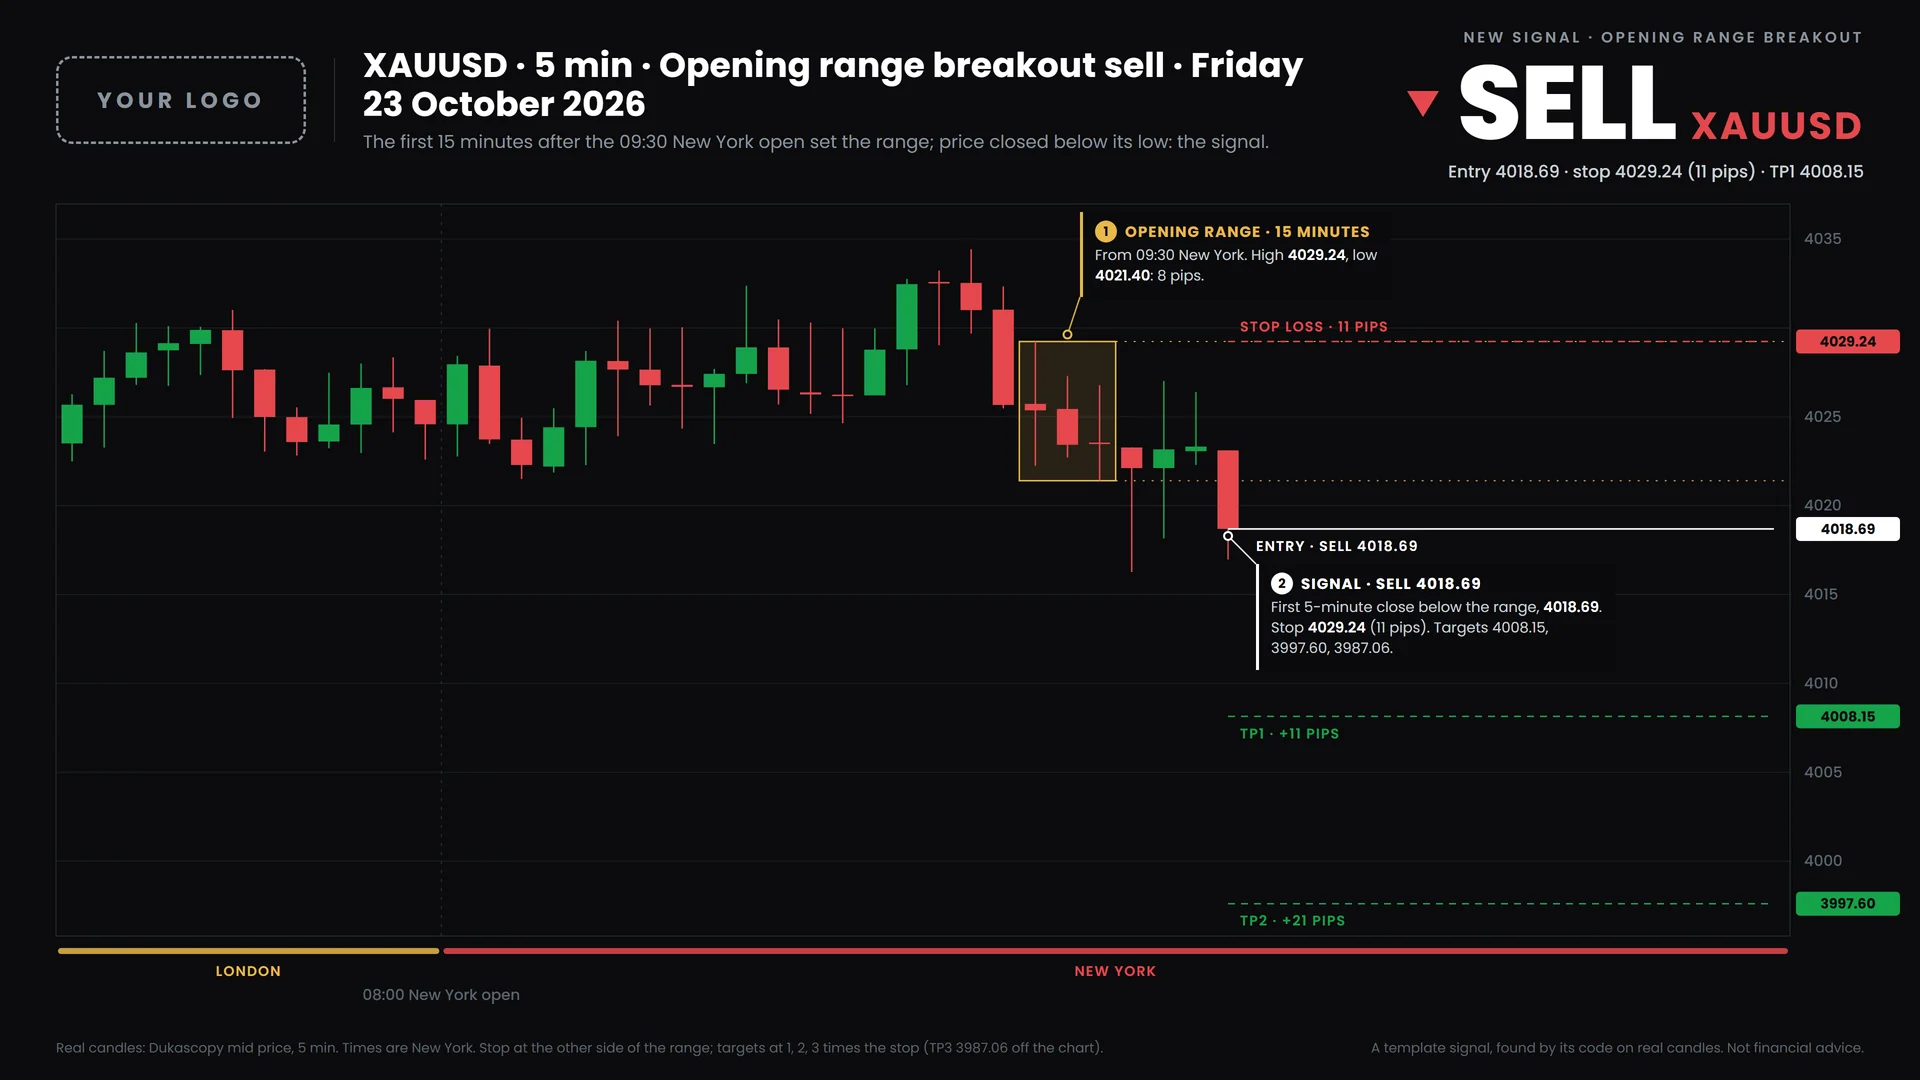
Opening range breakout
The first 15 minutes after the New York open set a range; the first 5-minute close outside it is the signal.
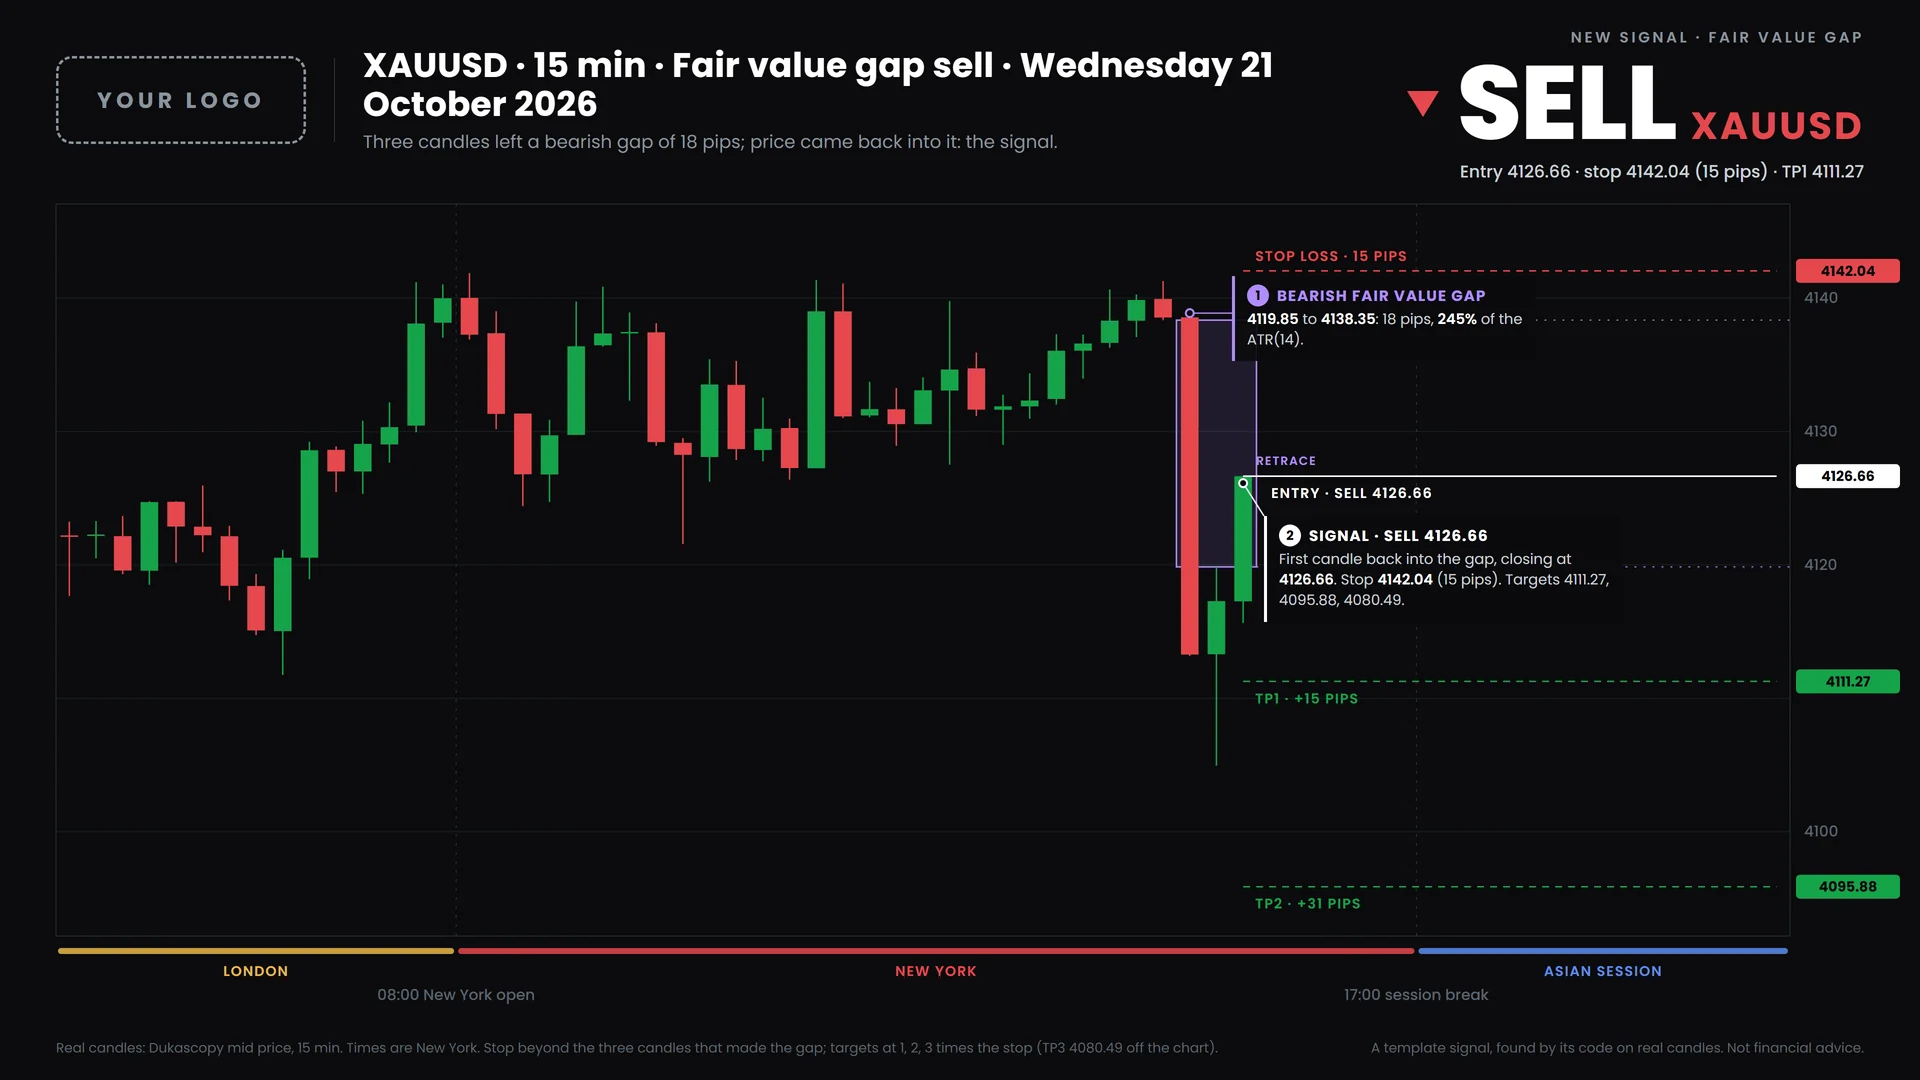
Fair value gap
Three candles leave a gap that price skipped; the first candle to come back into it is the signal.
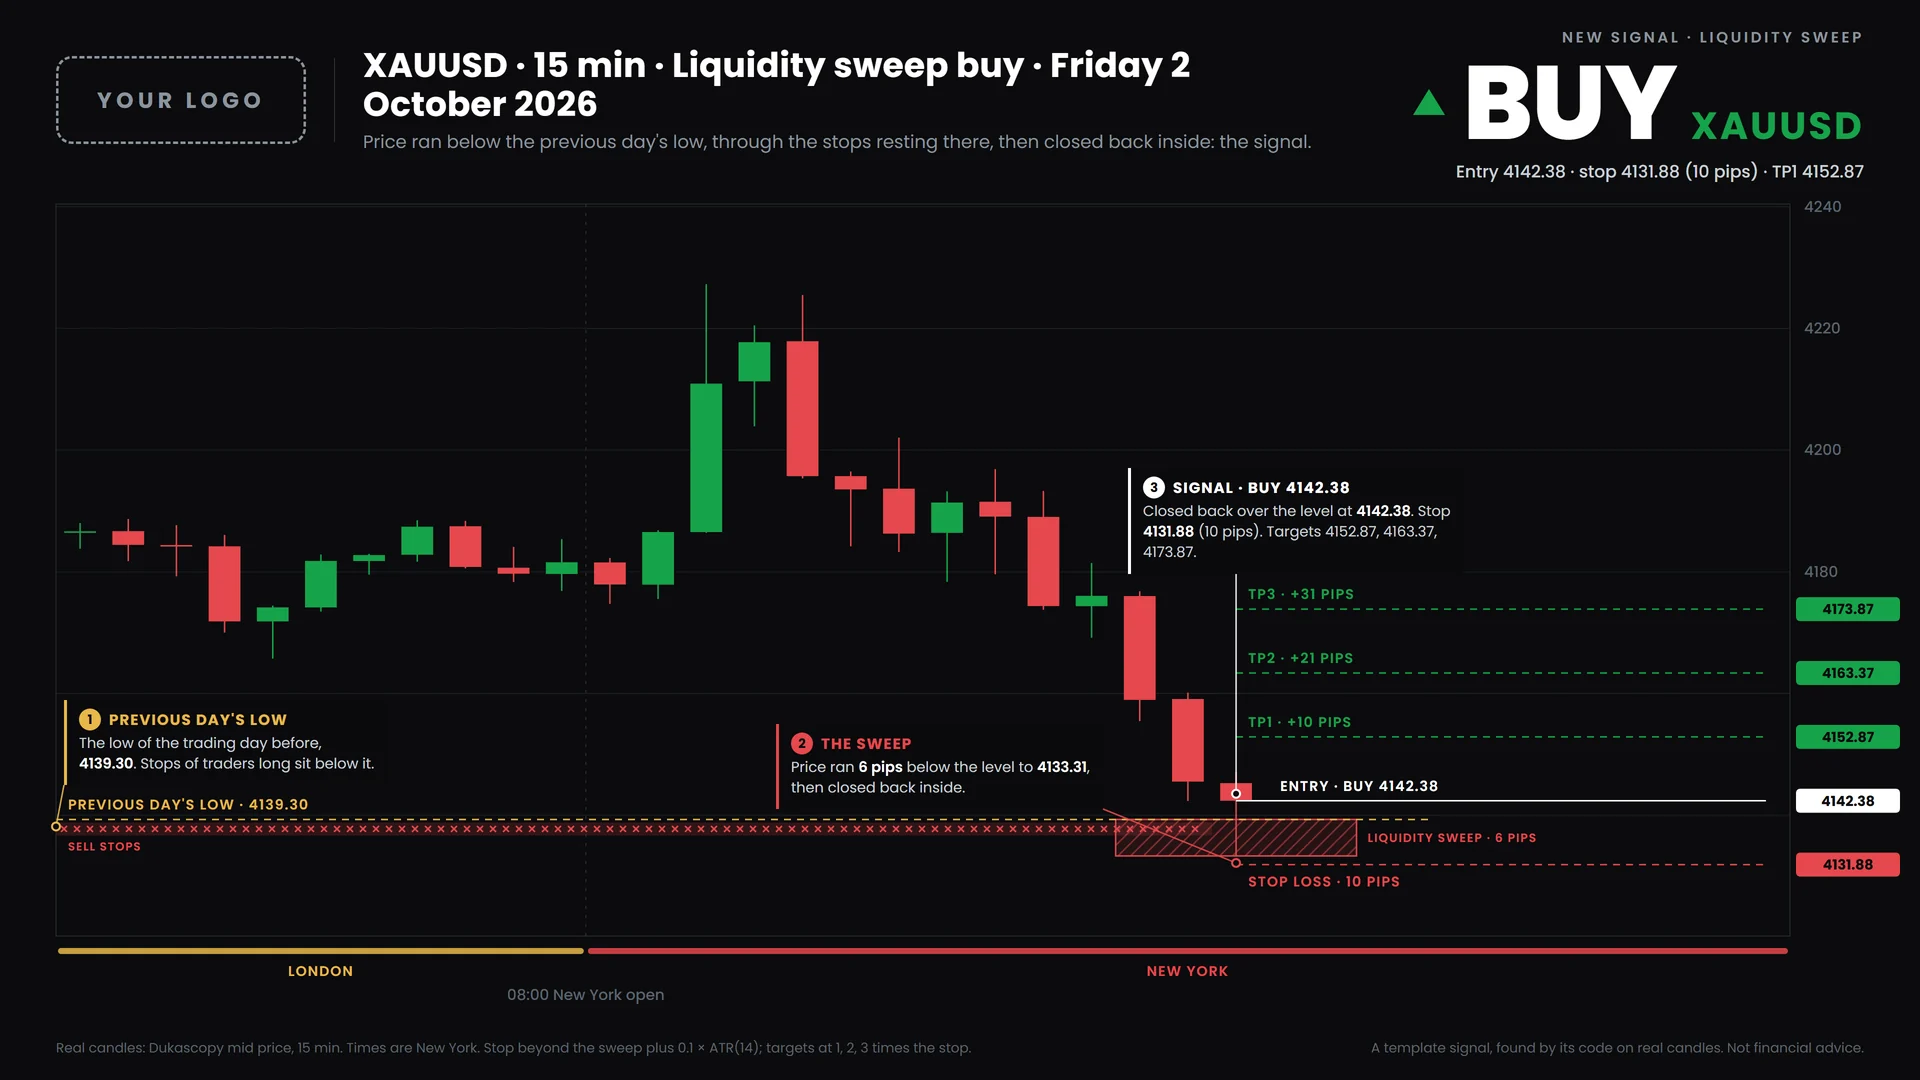
Liquidity sweep
Price runs through the previous day's high or low, then a 15-minute candle closes back inside the level: that close is the signal.
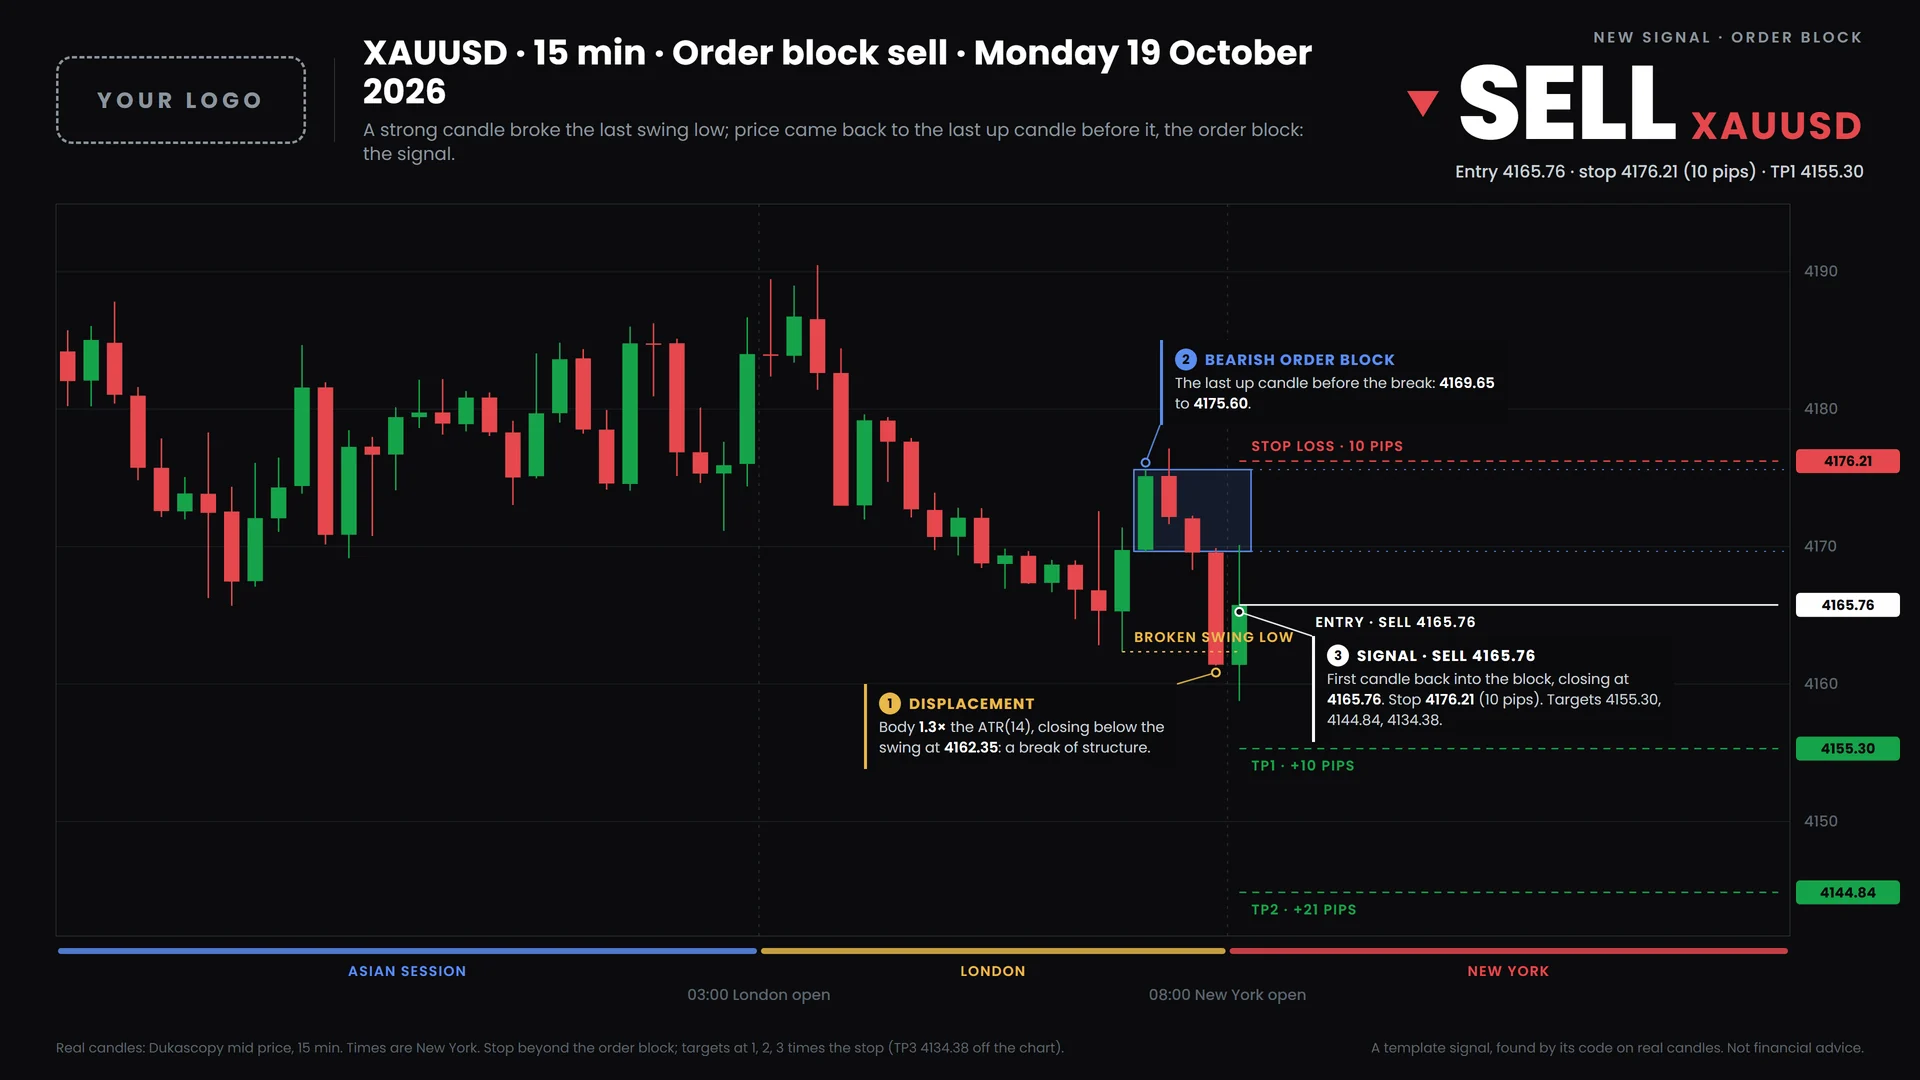
Order block
A strong candle breaks the last swing high; the last down candle before it is the block, and the first return into it is the signal.
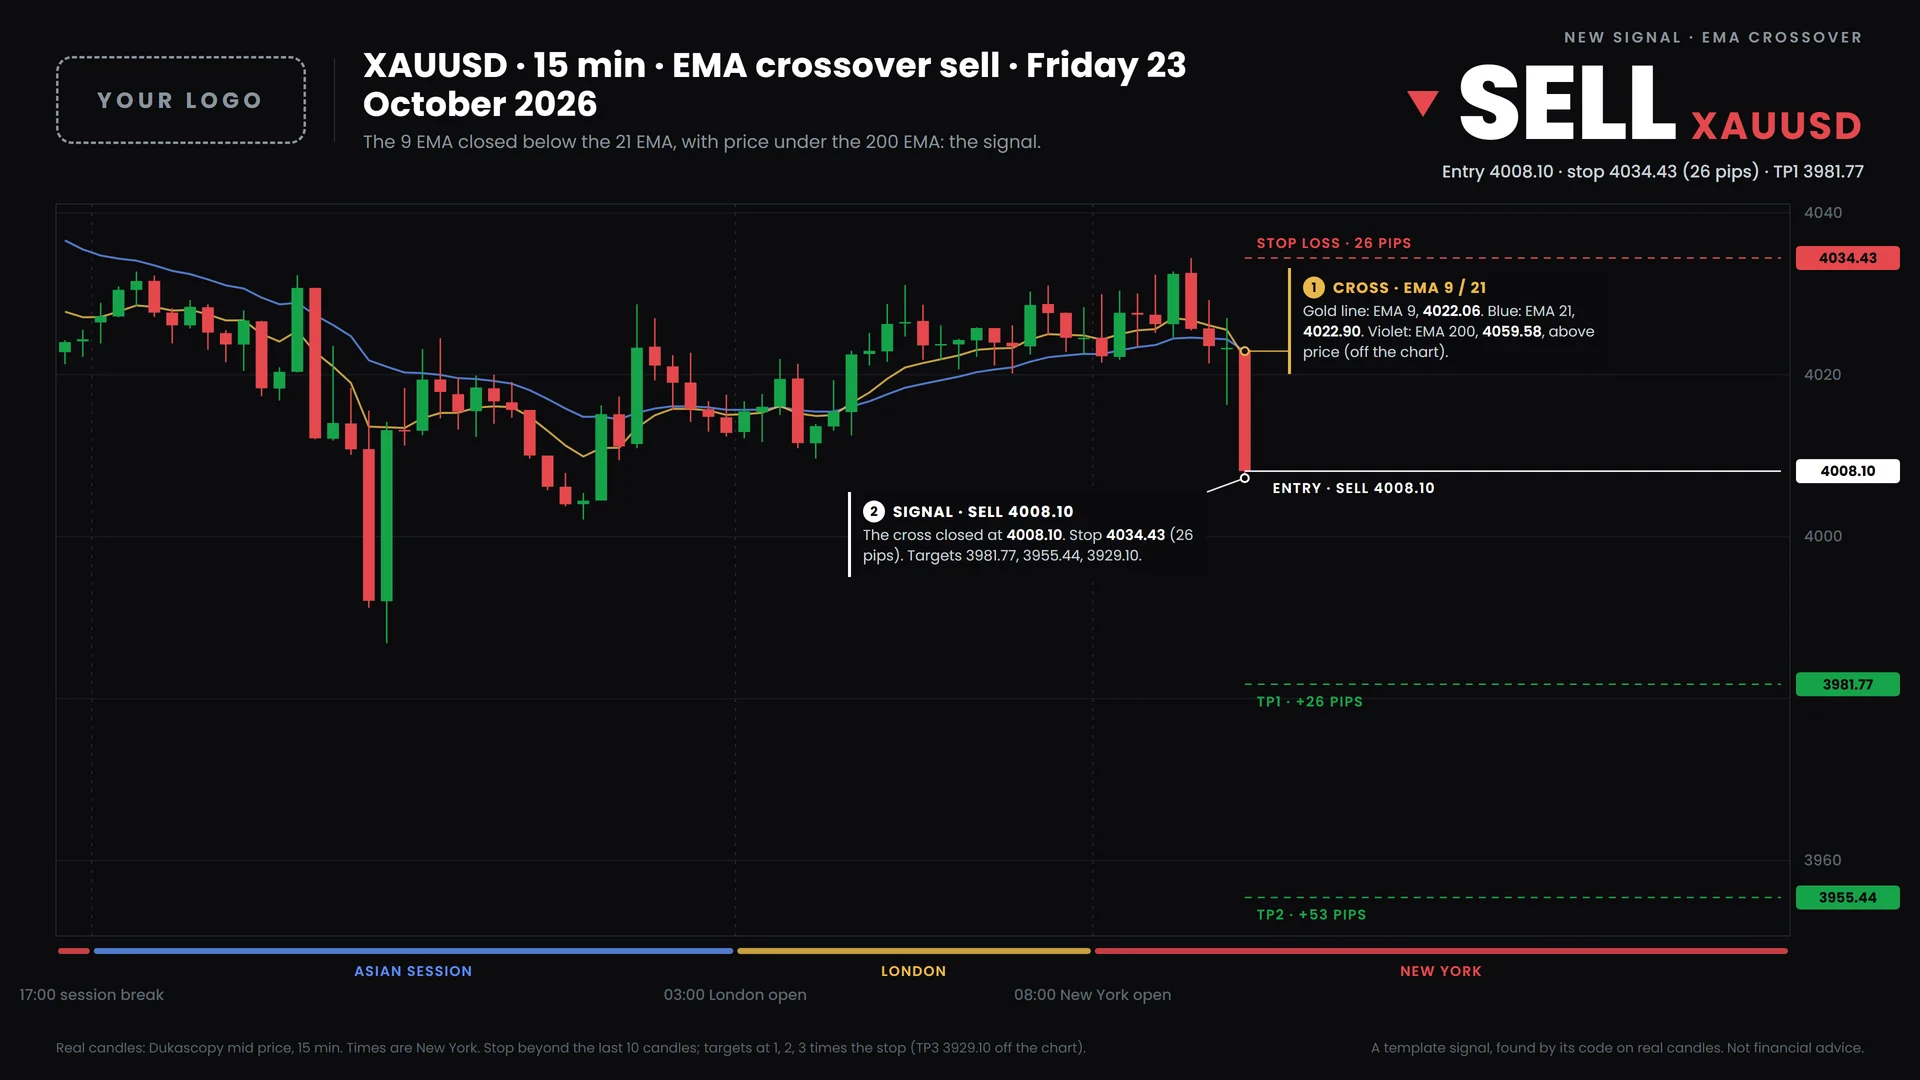
EMA crossover
The 9 EMA closes across the 21 EMA in the direction of the 200 EMA: a buy above it, a sell below it.
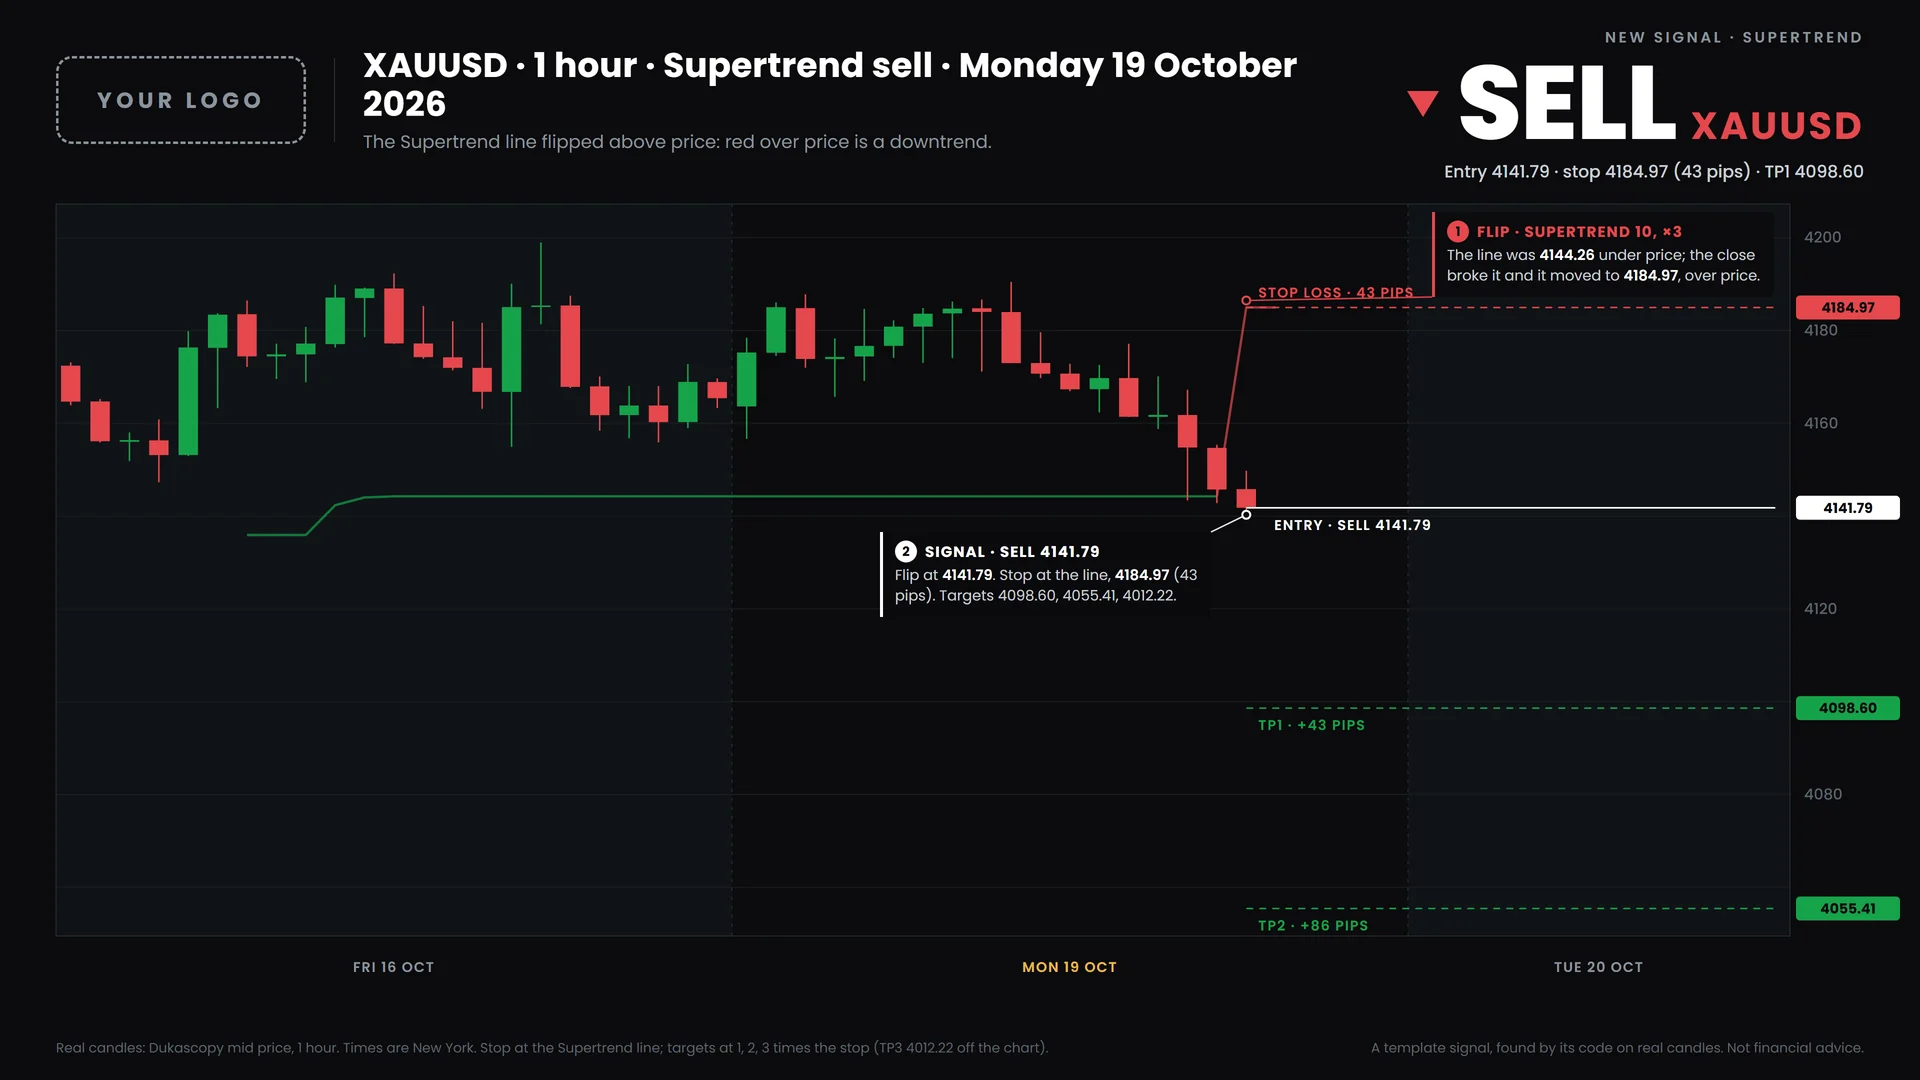
Supertrend
The Supertrend line (ATR 10 × 3) flips from above price to below it, or the other way: the candle that closes through it is the signal.
London breakout
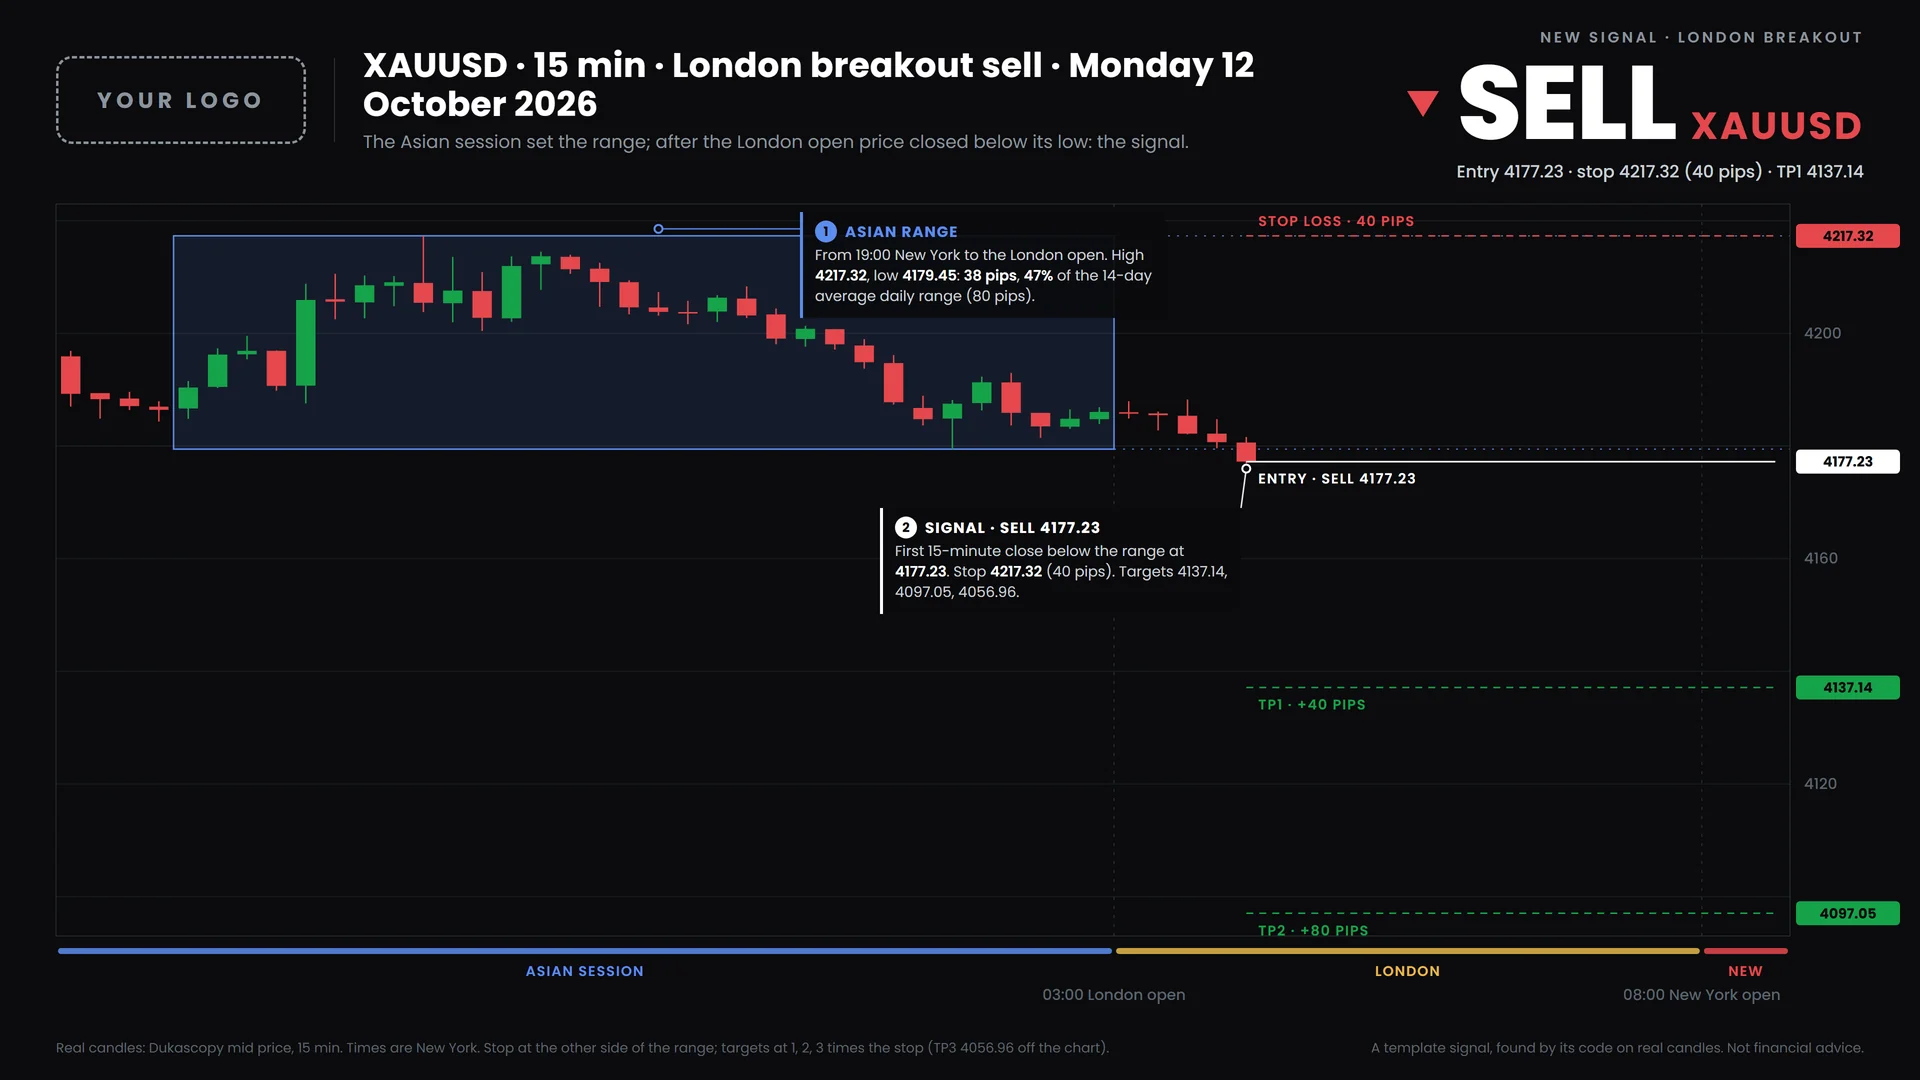
The Asian session sets a range; the first 15-minute close above its high or below its low after the London open is the signal.
Break and retest
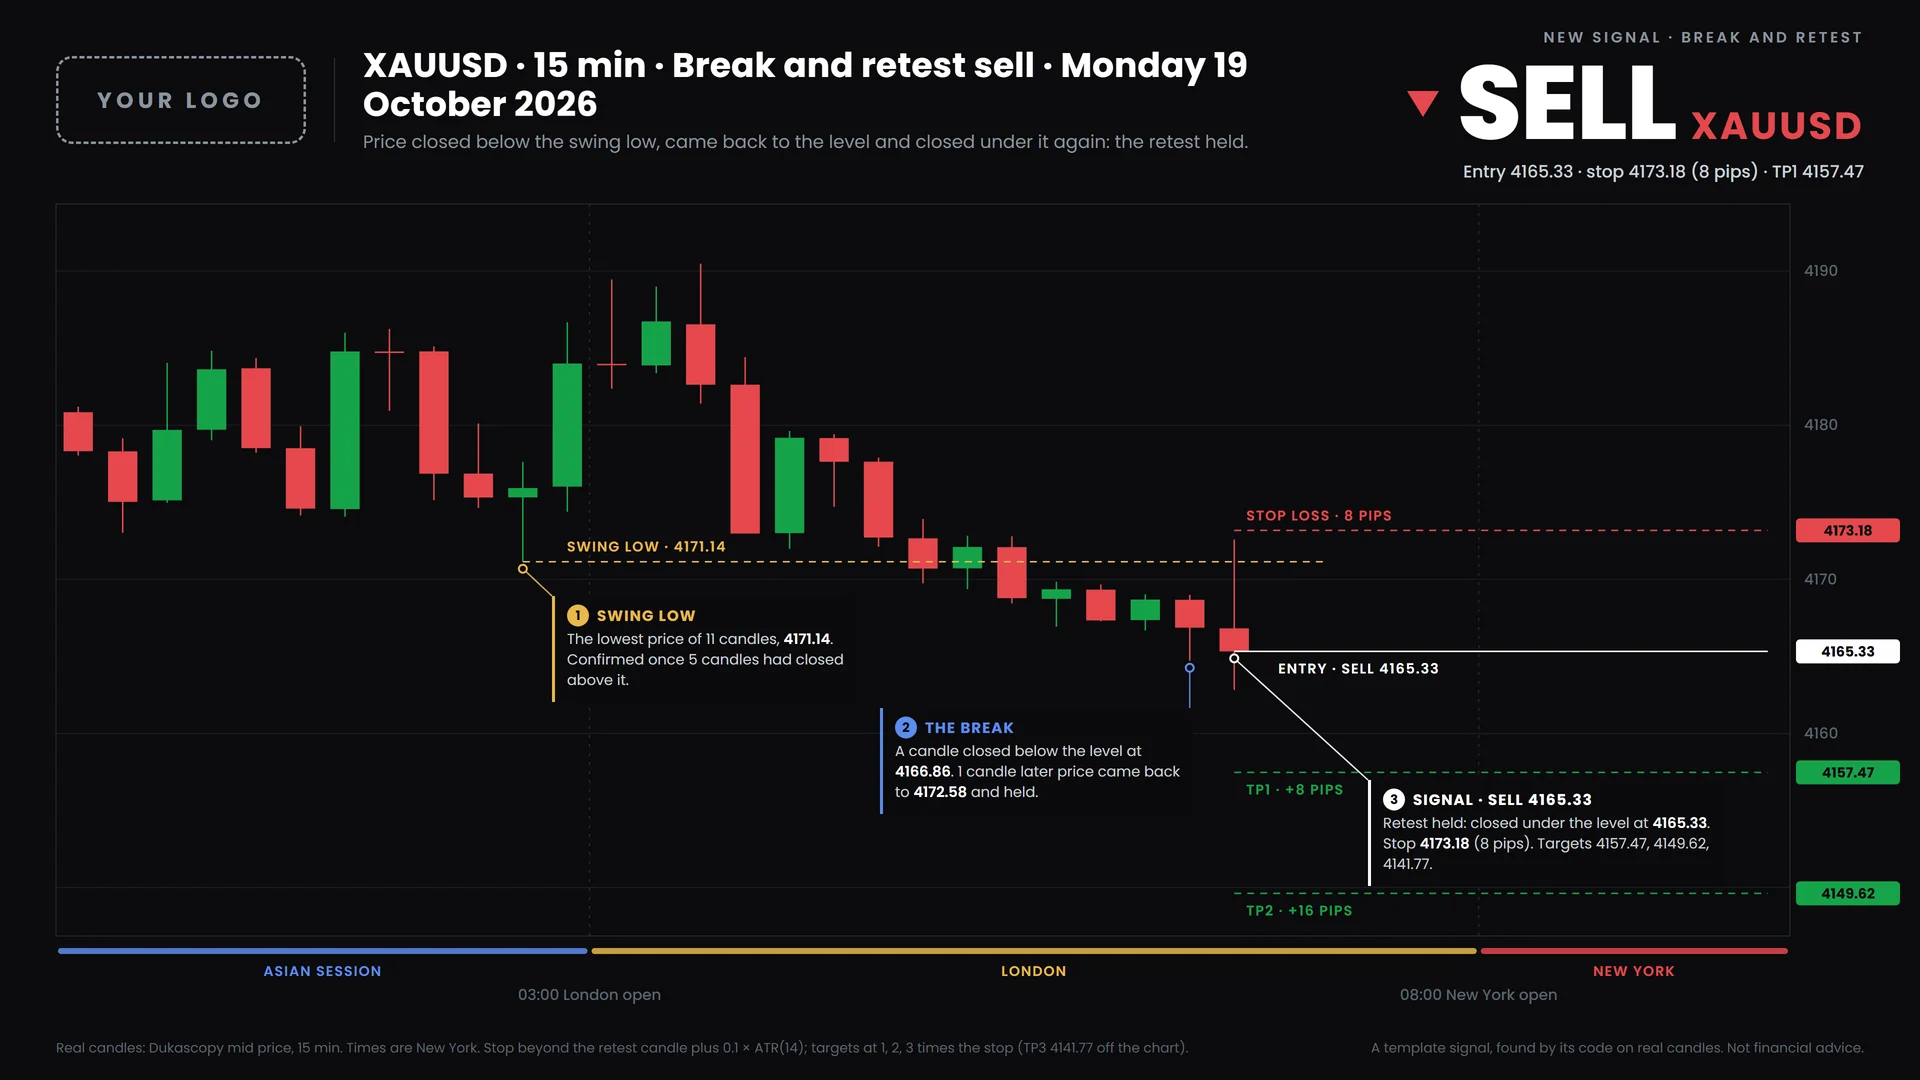
Price closes beyond a swing high or low, comes back to the level within twelve candles and closes on the broken side: that close is the signal.
MACD crossover
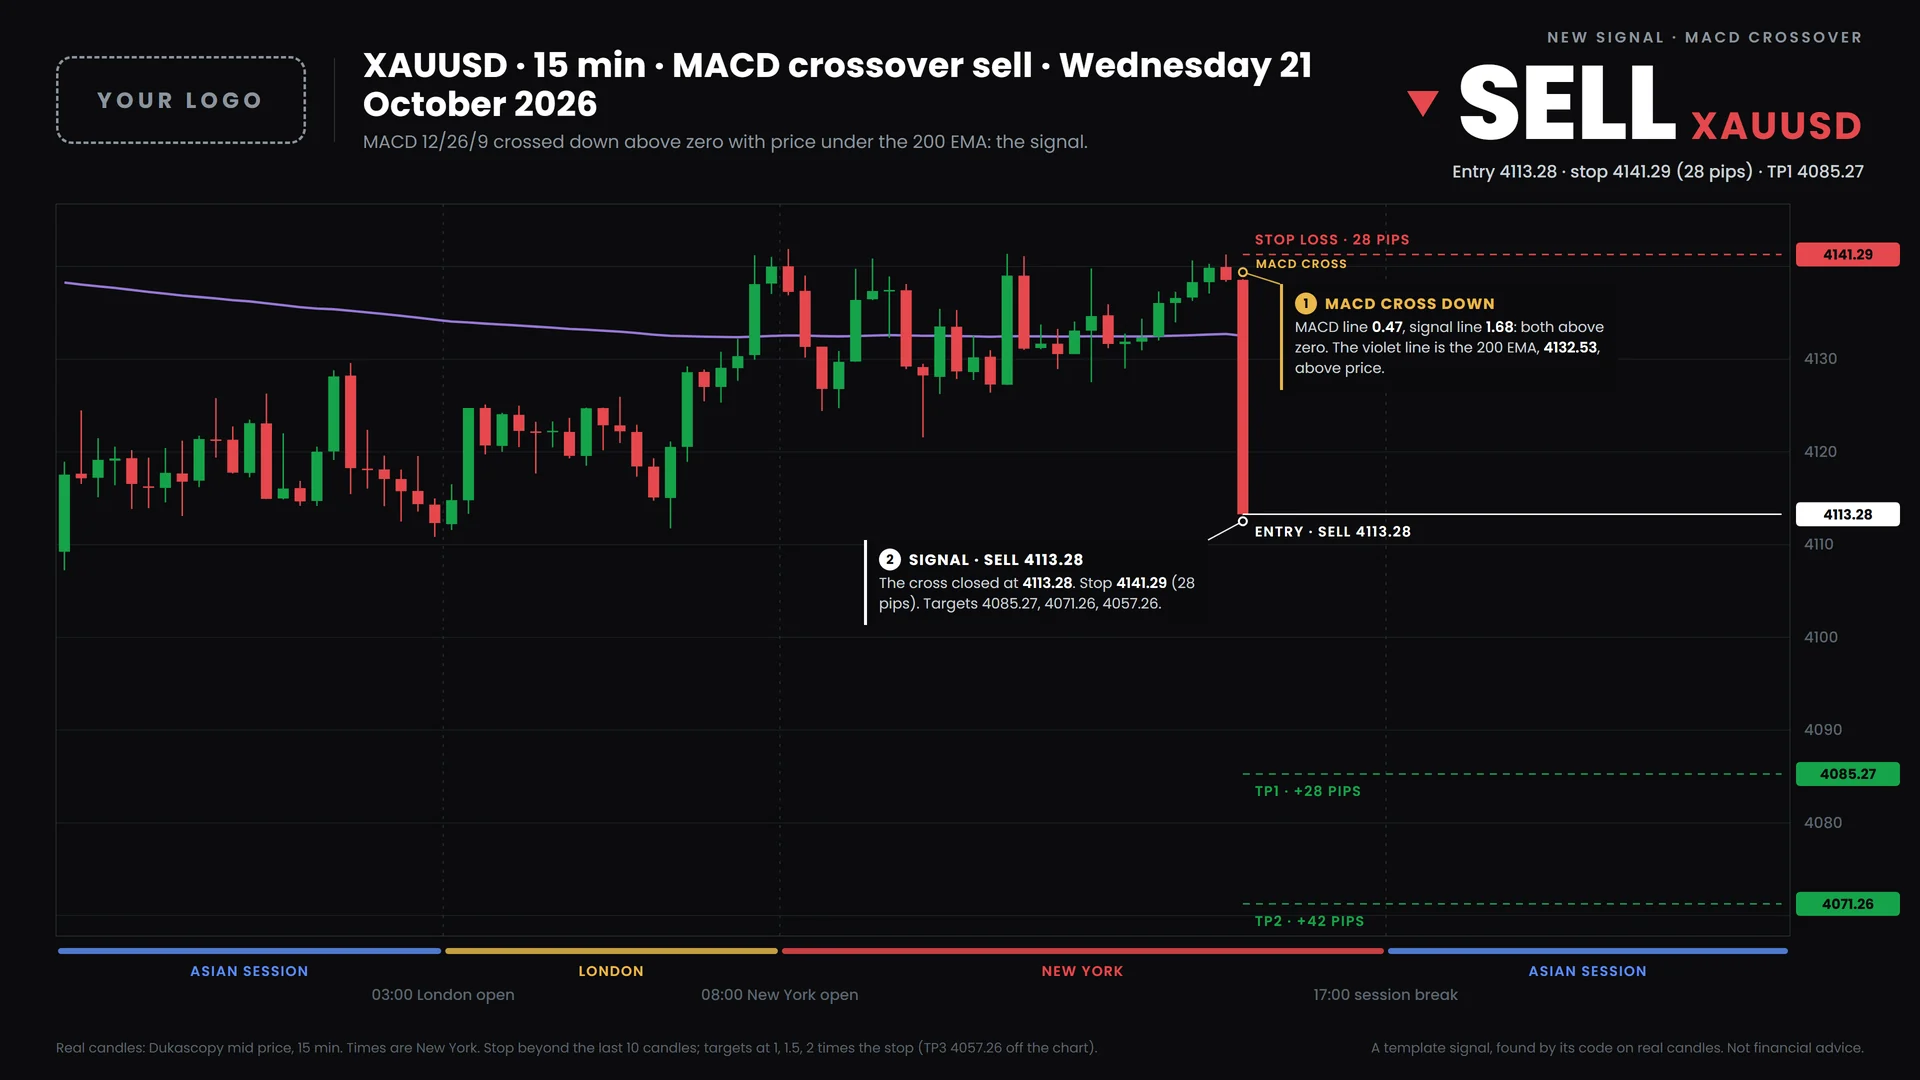
The MACD line crosses its signal line below zero in an uptrend, or above zero in a downtrend, with price on the 200 EMA's side.
Silver bullet
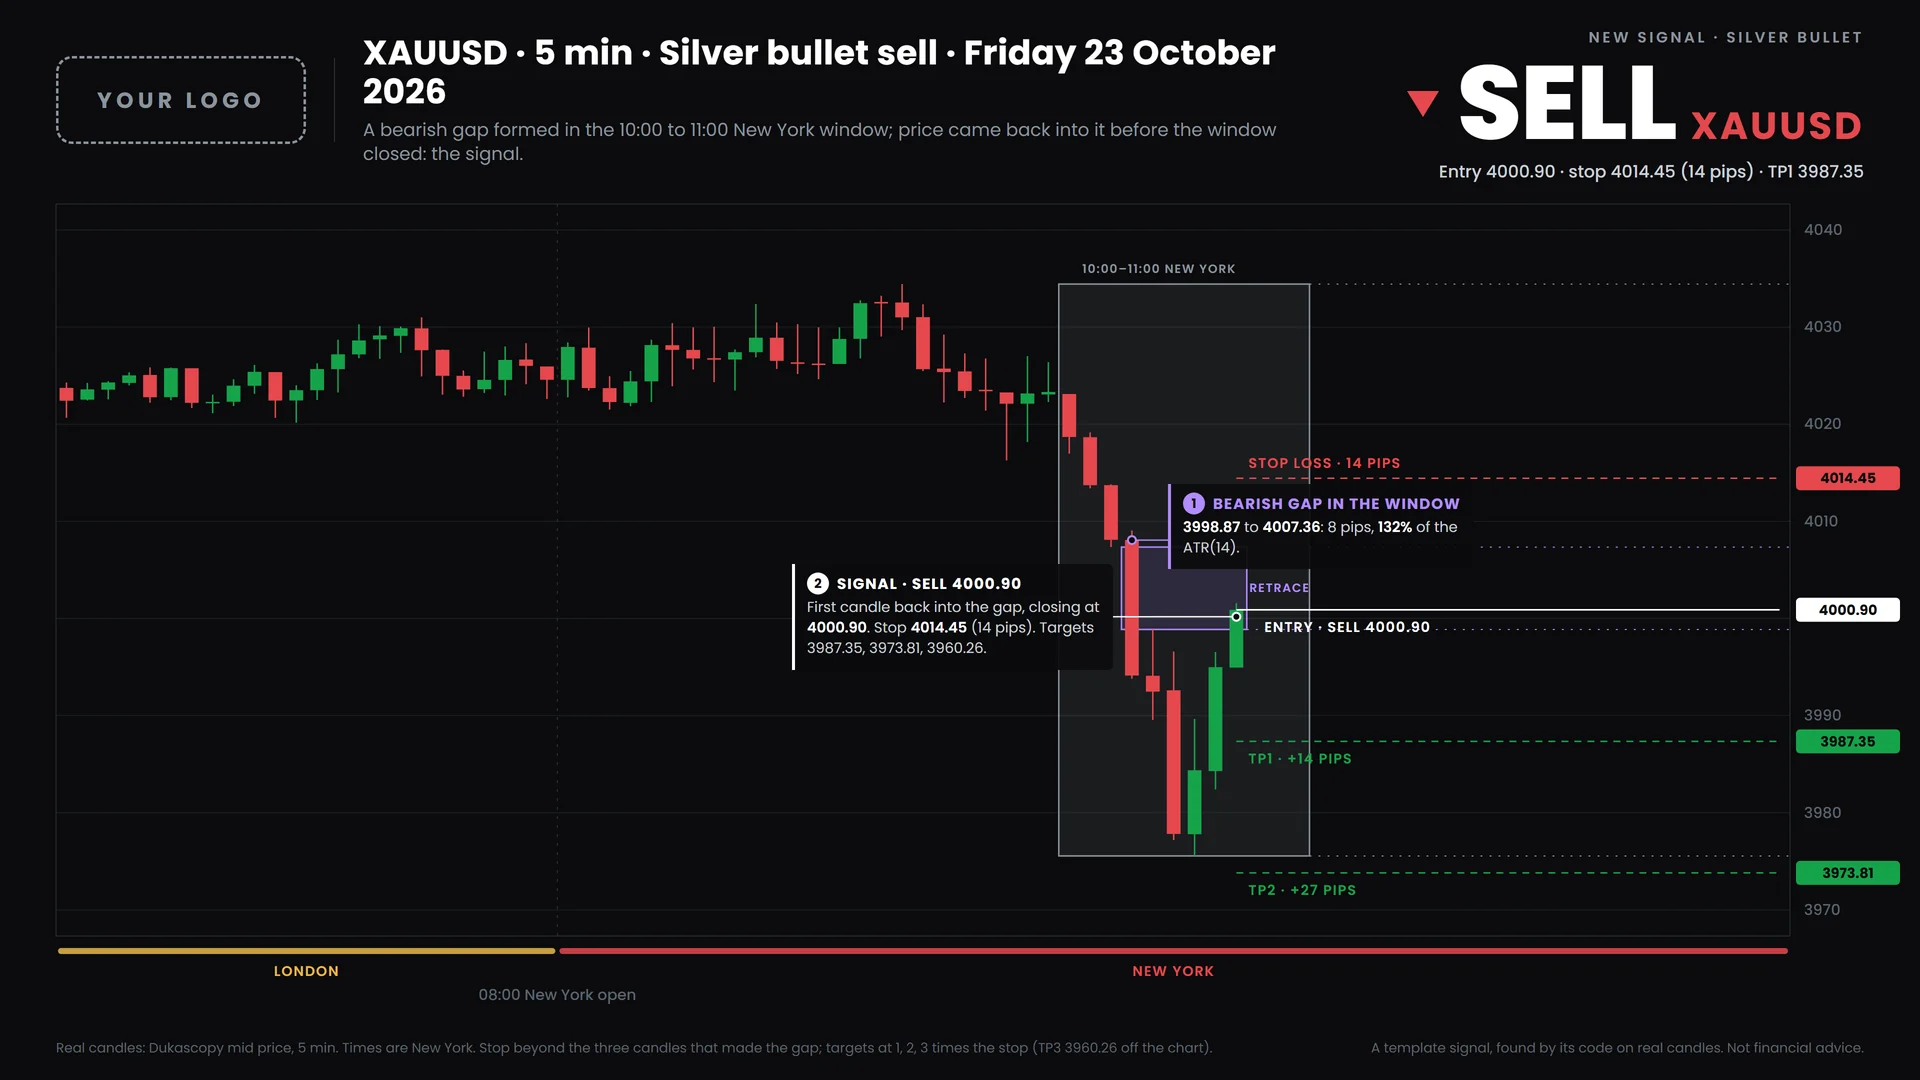
A fair value gap forms in the 10:00 to 11:00 New York window; the first candle back into it before 11:00 is the signal.
Judas swing
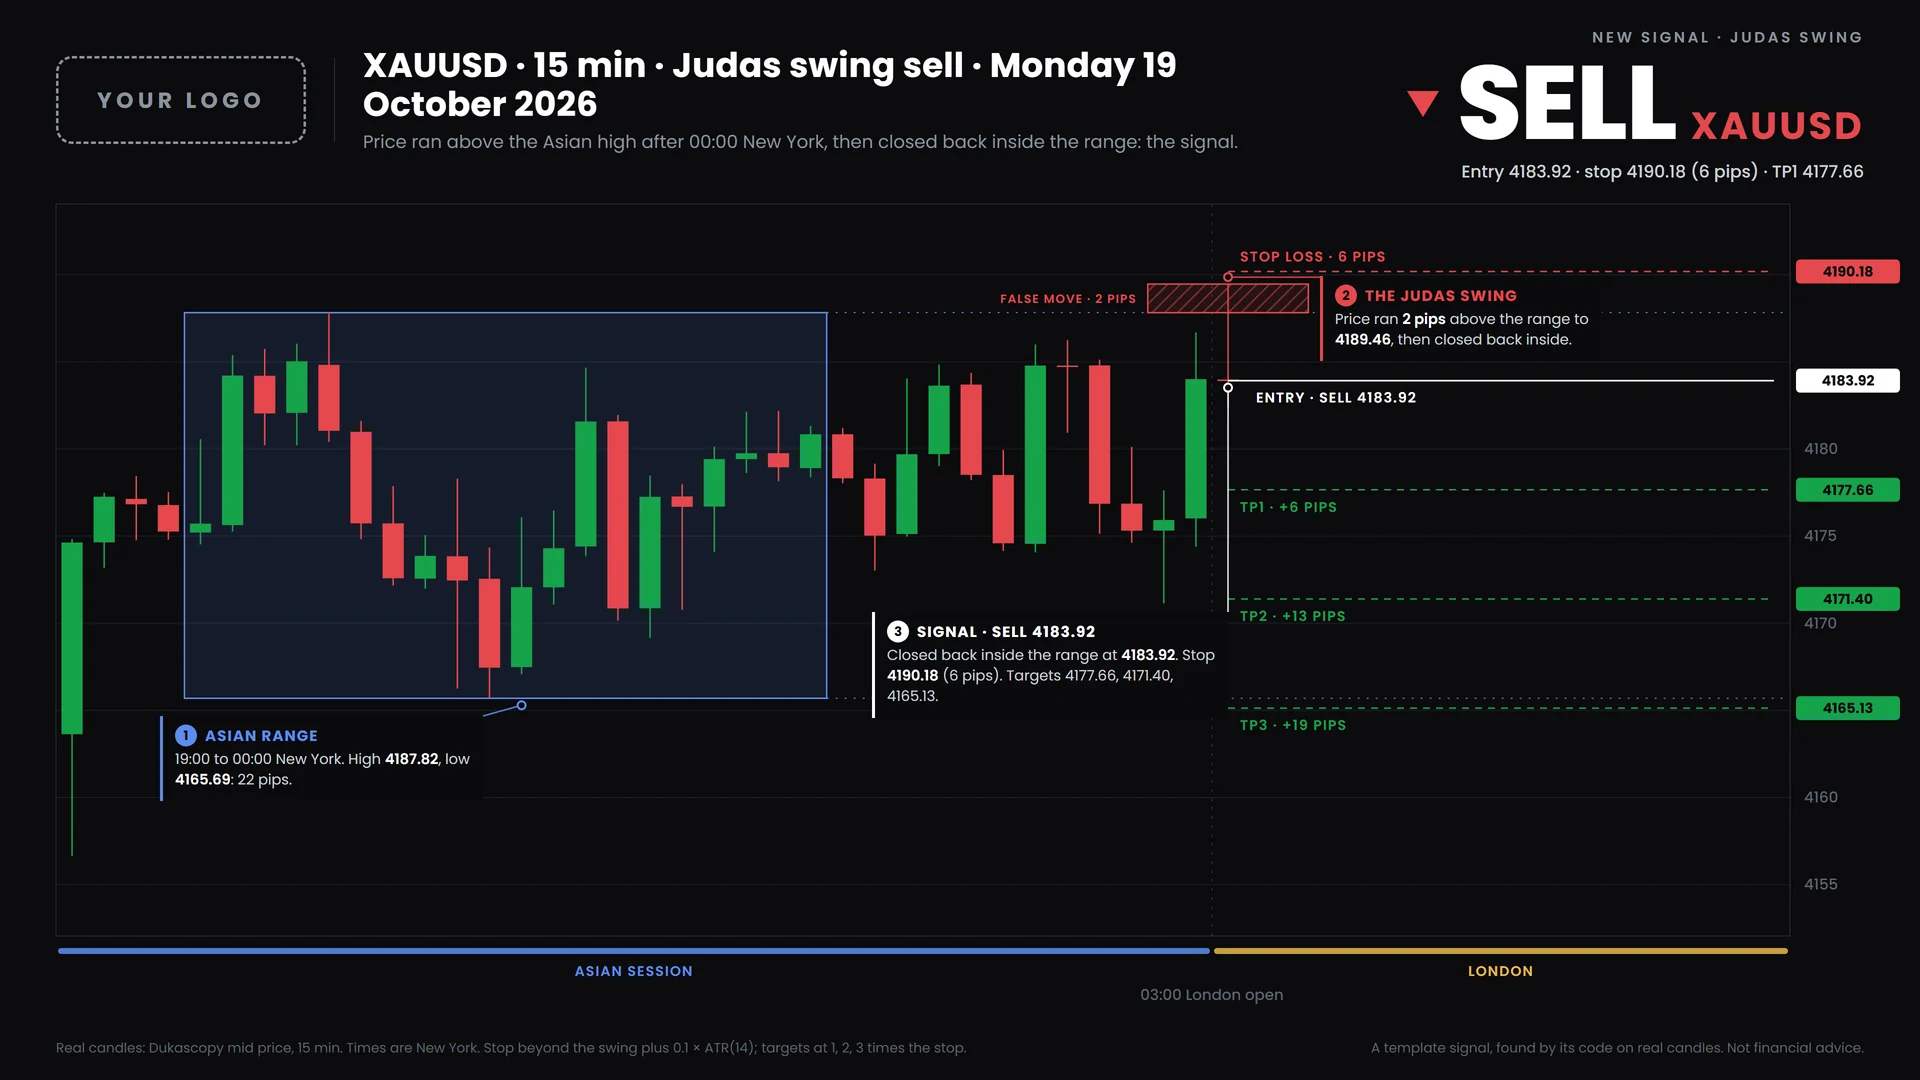
A candle runs through the Asian range early in London, then a 15-minute candle closes back inside it: that close is the signal.